

Question: matlab code with explanation 2. Mesh and Contour Plots Consider the following function ()- where c is a constant. For c 50 a) Plot f(r)
matlab code with explanation
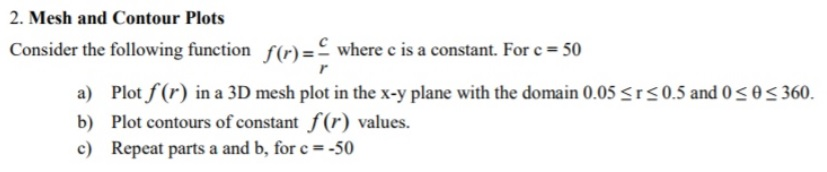
2. Mesh and Contour Plots Consider the following function ()- where c is a constant. For c 50 a) Plot f(r) in a 3D mesh plot in the x-y plane with the domain 0.05s r b) Plot contours of constant f(r) values. c) Repeat parts a and b, for c = .50 0.5 and 0 360
Step by Step Solution
There are 3 Steps involved in it
1 Expert Approved Answer
Step: 1 Unlock

Question Has Been Solved by an Expert!
Get step-by-step solutions from verified subject matter experts
Step: 2 Unlock
Step: 3 Unlock