

Question: MATLAB CODE: Write a function to implement the following graph for a single value of x . Write a script that calls this function in
MATLAB CODE:
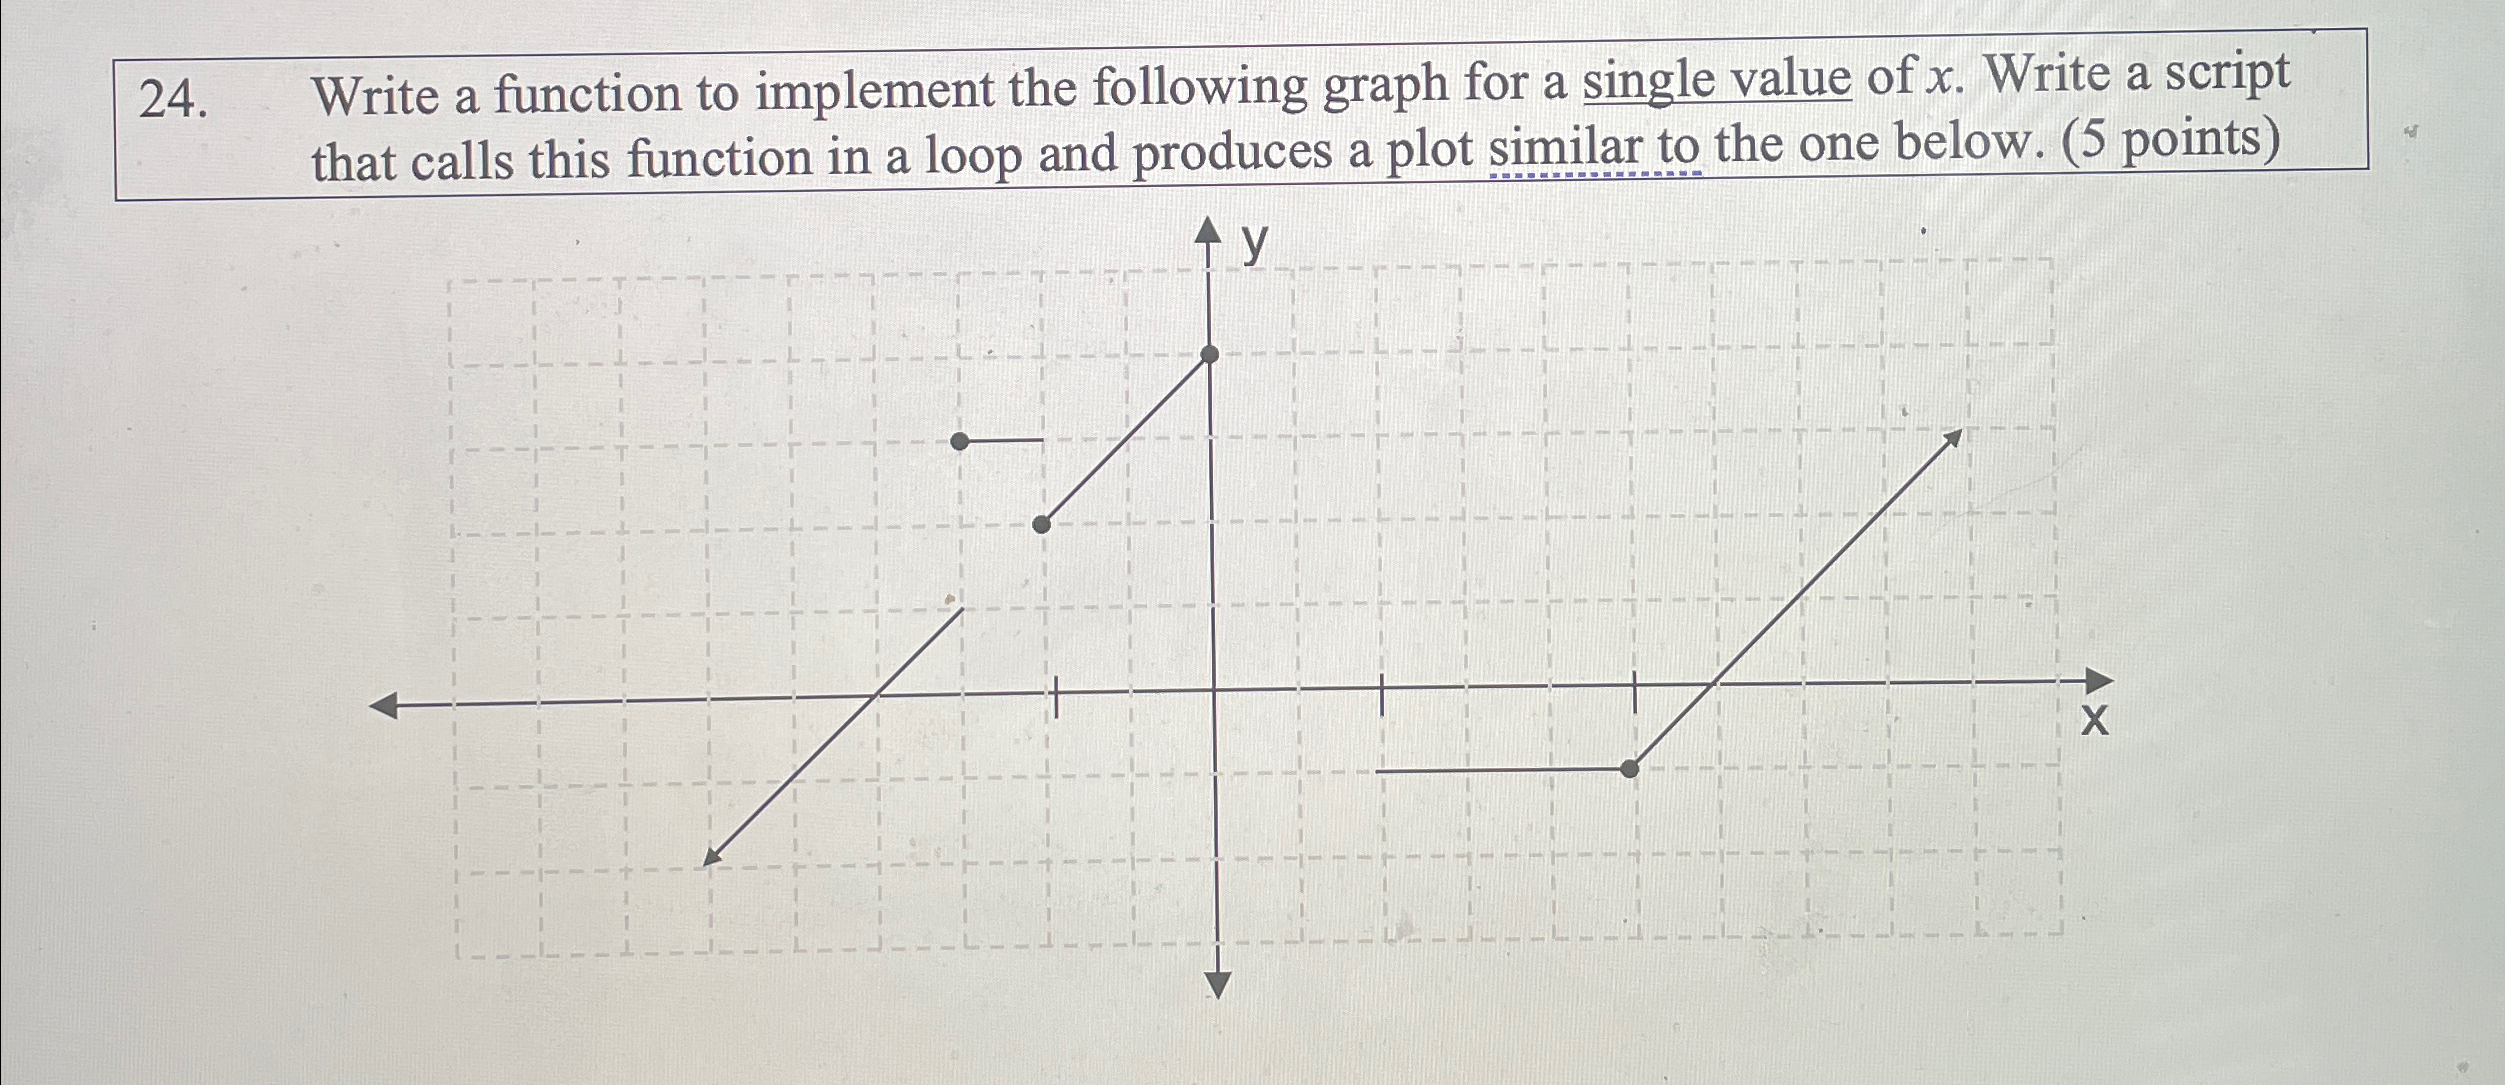
Write a function to implement the following graph for a single value of Write a script that calls this function in a loop and produces a plot similar to the one below. points
Step by Step Solution
There are 3 Steps involved in it
1 Expert Approved Answer
Step: 1 Unlock

Question Has Been Solved by an Expert!
Get step-by-step solutions from verified subject matter experts
Step: 2 Unlock
Step: 3 Unlock