

Question: MATLAB coding. The following data measured the drying time, T, for paint as a function of the amount of additive A in the mix. A.
MATLAB coding.
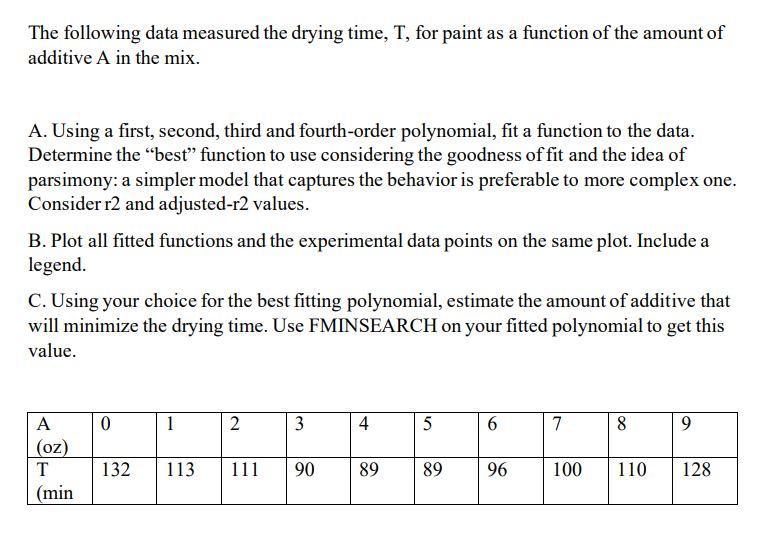
The following data measured the drying time, T, for paint as a function of the amount of additive A in the mix. A. Using a first, second, third and fourth-order polynomial, fit a function to the data. Determine the "best function to use considering the goodness of fit and the idea of parsimony: a simpler model that captures the behavior is preferable to more complex one. Consider r2 and adjusted-r2 values. B. Plot all fitted functions and the experimental data points on the same plot. Include a legend. C. Using your choice for the best fitting polynomial, estimate the amount of additive that will minimize the drying time. Use FMINSEARCH on your fitted polynomial to get this value. 0 1 2 3 4 5 6 7 8 9 A (oz) T (min 132 113 111 90 89 89 96 100 110 128
Step by Step Solution
There are 3 Steps involved in it

Get step-by-step solutions from verified subject matter experts