

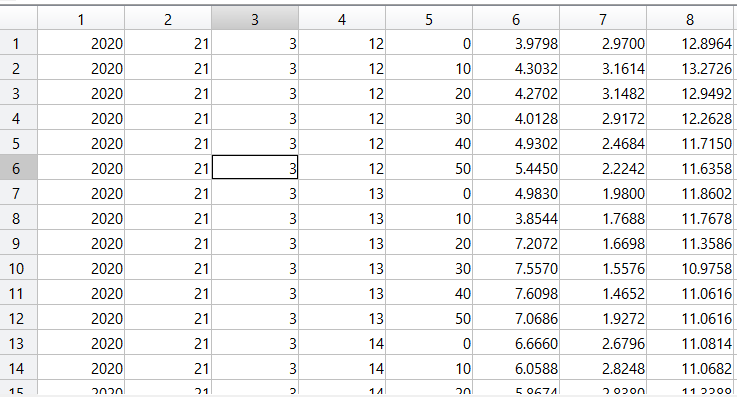
Question: MATLAB CODING THIS IS WHAT THE DATA MATRIX LOOKS LIKE. THE FIRST 5 COLUMNS ARE YEAR,DAY,MONTH,HOUR,MIN. THE LAST 3 COLUMNS ARE THE WINDSPEEDS FOR 3
MATLAB CODING
THIS IS WHAT THE DATA MATRIX LOOKS LIKE. THE FIRST 5 COLUMNS ARE YEAR,DAY,MONTH,HOUR,MIN. THE LAST 3 COLUMNS ARE THE WINDSPEEDS FOR 3 DIFFERENT LOCATIONS
Q1e - (10 Marks) It turns out there are some unrealistic measurements and outliers that need to be removed. These correspond to wind speeds less than zero, or where the absolute difference between the hourly average and the wind speed is greater than 80%. Extract the valid wind speed and recording date and time for each wind farm and store in three separate 2D matrices. Use fprintf() to output the total number of points that have been removed for each wind farm location. Since time recordings are every 10 minutes, 6 consecutive data points corresponds to an hour. When determining outliers, check the first six data points independently to the hourly average, and move onto the next six data points and compare to the second hourly average. Repeat these steps until you have covered the whole years' worth of measurements
Step by Step Solution
There are 3 Steps involved in it

Get step-by-step solutions from verified subject matter experts