

Question: MATLAB CODING:DIGITAL SIGNAL PROCESSING 4 Additional task The electrocardiogram ECG signal contains a power-line noise of 50/60 Hz (depending on the country). The power-line noise
MATLAB CODING:DIGITAL SIGNAL PROCESSING
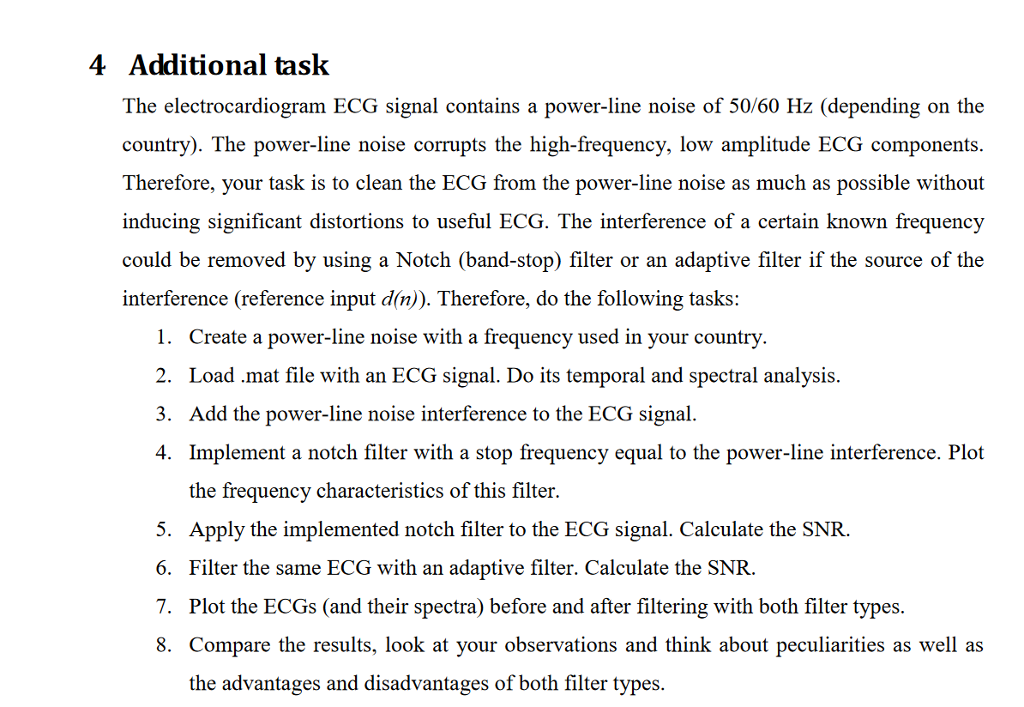
4 Additional task The electrocardiogram ECG signal contains a power-line noise of 50/60 Hz (depending on the country). The power-line noise corrupts the high-frequency, low amplitude ECG components. Therefore, your task is to clean the ECG from the power-line noise as much as possible without inducing significant distortions to useful ECG. The interference of a certain known frequency could be removed by using a Notch (band-stop) filter or an adaptive filter if the source of the interference (reference input dn)). Therefore, do the following tasks: 1. Create a power-line noise with a frequency used in your country. 2. Load .mat file with an ECG signal. Do its temporal and spectral analysis. 3. Add the power-line noise interference to the ECG signal. 4. Implement a notch filter with a stop frequency equal to the power-line interference. Plot the frequency characteristics of this filter. 5. Apply the implemented notch filter to the ECG signal. Calculate the SNR. 6. Filter the same ECG with an adaptive filter. Calculate the SNR. 7. Plot the ECGs (and their spectra) before and after filtering with both filter types. S. Compare the results, look at your observations and think about peculiarities as well as the advantages and disadvantages of both filter types
Step by Step Solution
There are 3 Steps involved in it

Get step-by-step solutions from verified subject matter experts