

Question: MATLAB: Combine four (2 by 2) plot windows on one figure for the following four functions for x = 0 to 10 with an increment
MATLAB: Combine four (2 by 2) plot windows on one figure for the following four functions for x = 0 to 10 with an increment of 0.1. 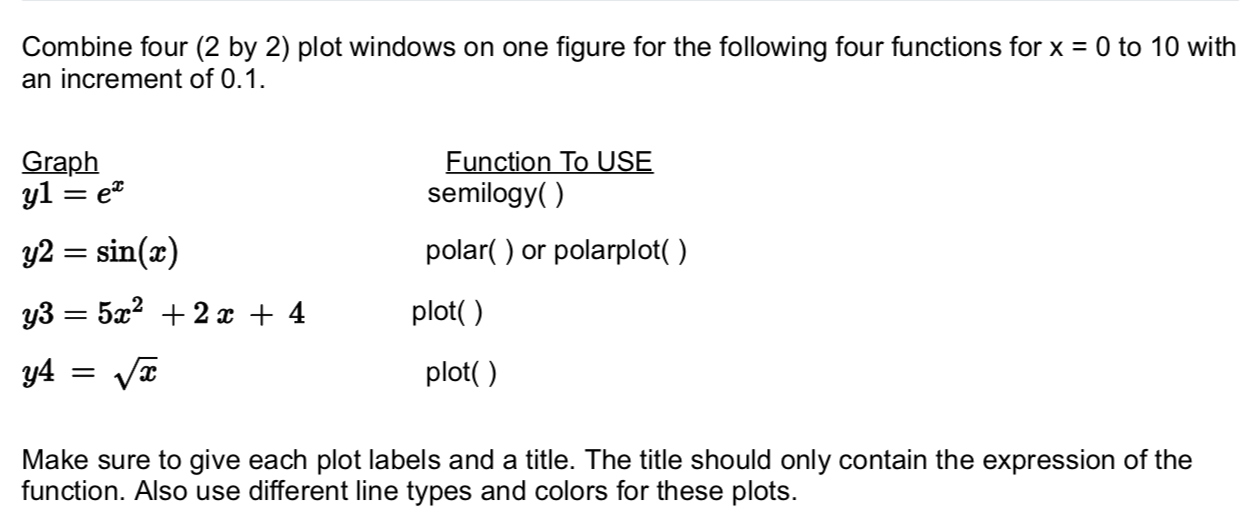
Combine four (2 by 2) plot windows on one figure for the following four functions for x = 0 to 10 with an increment of 0.1. Graph yl = em Function To USE semilogy() polar() or polarplot() y2 = sin(x) y3 = 5x2 + 2x + 4 y4 plot() = plot() Make sure to give each plot labels and a title. The title should only contain the expression of the function. Also use different line types and colors for these plots
Step by Step Solution
There are 3 Steps involved in it
1 Expert Approved Answer
Step: 1 Unlock

Question Has Been Solved by an Expert!
Get step-by-step solutions from verified subject matter experts
Step: 2 Unlock
Step: 3 Unlock