

Question: MATLAB.......... Consider the following test script that simulates the throw of two dice: clear; rng(100); outcomes = roll2(10); summary = mytab(outcomes); disp(summary); histogram(outcomes); It generates
MATLAB..........
Consider the following test script that simulates the throw of two dice:
clear;
rng(100);
outcomes = roll2(10);
summary = mytab(outcomes);
disp(summary);
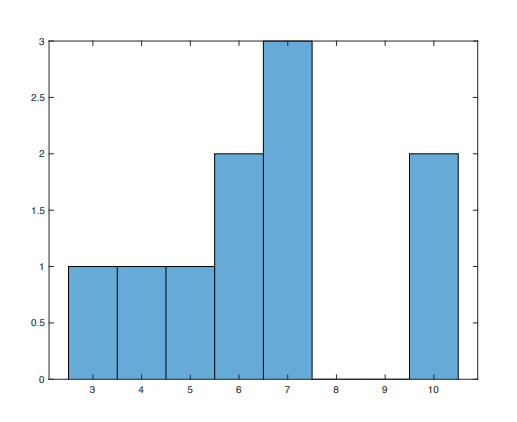
histogram(outcomes);
It generates the following outputs.
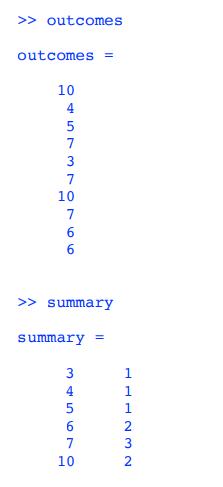
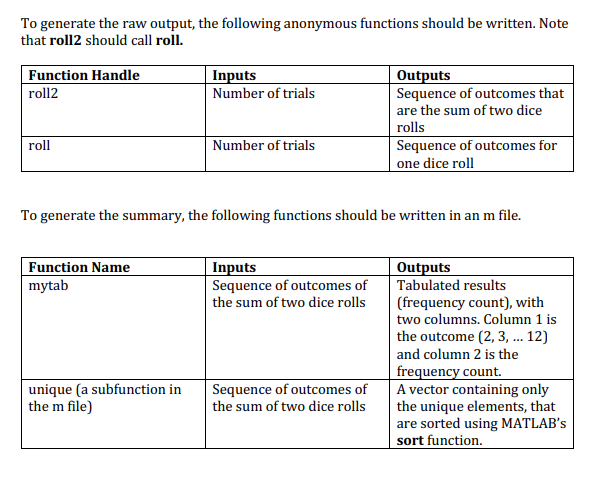
>> outcomes outcomes = 10 4 5 7 3 7 10 7 6 6 >> summary summary = 3 4 5 6 7 10 NWNPPP 3 2.5 2 1.5 0.5 0 3 4 5 6 7 8 9 10 To generate the raw output, the following anonymous functions should be written. Note that roll2 should call roll. Function Handle roll2 Inputs Number of trials Outputs Sequence of outcomes that are the sum of two dice rolls Sequence of outcomes for one dice roll roll Number of trials To generate the summary, the following functions should be written in an m file. Function Name mytab Inputs Sequence of outcomes of the sum of two dice rolls Outputs Tabulated results (frequency count), with two columns Column 1 is the outcome (2, 3, ... 12) and column 2 is the frequency count. A vector containing only the unique elements, that are sorted using MATLAB's sort function. unique (a subfunction in the m file) Sequence of outcomes of the sum of two dice rolls
Step by Step Solution
There are 3 Steps involved in it

Get step-by-step solutions from verified subject matter experts