

Question: MATLAB Exercise 4 : Use ezplot to plot cos ( x ) from - 2 pi to + 2 pi . Don't define
MATLAB Exercise :
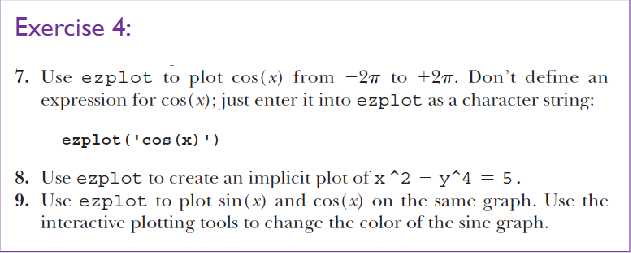
Use ezplot to plot cosx from pi to pi Don't define an
expression for cosx; just enter it into ezplot as a character string:
ezplotcosx
Use ezplot to create an implicit plot of xy
Usc ezplot to plot sinx and cosx on the same graph. Use the
interactive plotting tools to change the color of the sine graph.
Had some code but it would not give me an output. Looking for help. MATLAB
Step by Step Solution
There are 3 Steps involved in it
1 Expert Approved Answer
Step: 1 Unlock

Question Has Been Solved by an Expert!
Get step-by-step solutions from verified subject matter experts
Step: 2 Unlock
Step: 3 Unlock