

Question: Matlab Format a) Plot this function F=6sin(x2)e0.75x in Matlab for x going from 0 to 10 . Use plenty of points so the function looks
Matlab Format 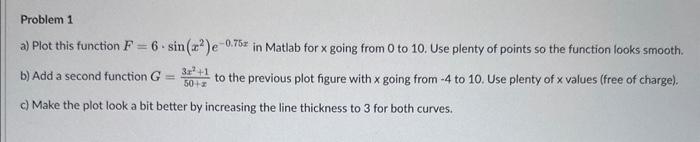
a) Plot this function F=6sin(x2)e0.75x in Matlab for x going from 0 to 10 . Use plenty of points so the function looks smooth. b) Add a second function G=50+x3x2+1 to the previous plot figure with going from 4 to 10 . Use plenty of x values (free of charge). c) Make the plot look a bit better by increasing the line thickness to 3 for both curves
Step by Step Solution
There are 3 Steps involved in it
1 Expert Approved Answer
Step: 1 Unlock

Question Has Been Solved by an Expert!
Get step-by-step solutions from verified subject matter experts
Step: 2 Unlock
Step: 3 Unlock