

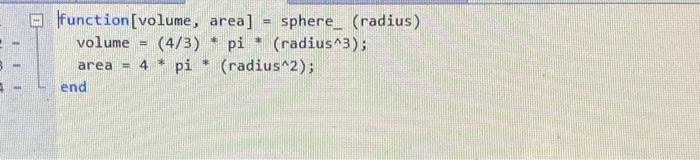
Question: matlab help for creating vectors and plotting with given code. need help changing the code into vectors and plotting. Elfunction[volume, area] - sphere_ (radius) volume
![changing the code into vectors and plotting. Elfunction[volume, area] - sphere_ (radius)](https://dsd5zvtm8ll6.cloudfront.net/si.experts.images/questions/2024/09/66f541f545f7a_23666f541f4d3146.jpg)
![area] cylinder_(radius, height) volume pi* (radius^2) *height; area 2*pi*radius* (radius+height); end 4](https://dsd5zvtm8ll6.cloudfront.net/si.experts.images/questions/2024/09/66f541f69e6d2_23866f541f63ecc0.jpg)
![5 6 - 7 height 10; cylinderVolume = []; cylinderArea = [];](https://dsd5zvtm8ll6.cloudfront.net/si.experts.images/questions/2024/09/66f541f760696_23866f541f6eb81c.jpg)
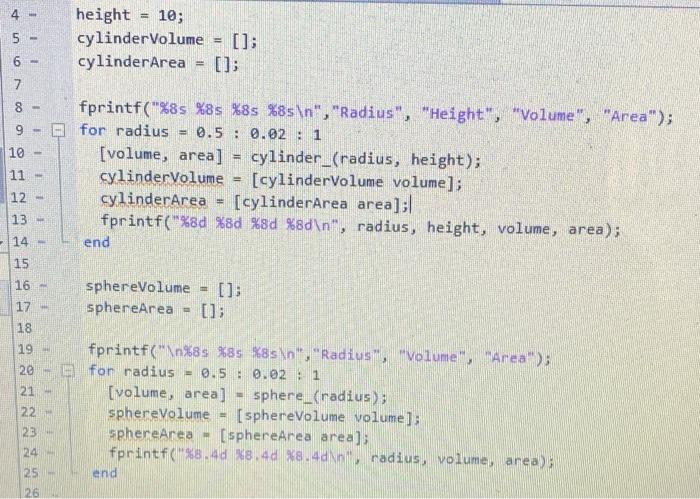
Elfunction[volume, area] - sphere_ (radius) volume (4/3) pi (radius^3); 4 pi * (radius^2); end area E function[volume, area] cylinder_(radius, height) volume pi* (radius^2) *height; area 2*pi*radius* (radius+height); end 4 5 6 - 7 height 10; cylinderVolume = []; cylinderArea = []; 00 9 10 11 12 13 fprintf("%s %85 %85 %s ", "Radius", "Height", "volume", "Area"); for radius 0.5 : 0.02 : 1 [volume, area] - cylinder_(radius, height); cylindervolume [cylindervolume volume]; cylinderArea = [cylinderArea area]: fprintf("%d %d %9d %d ", radius, height, volume, area); end 1 14 15 16 sphereVolume sphereArea - U; 17 18 19 20 21 22 23 fprintf(" %85 %85 %s ","Radius","volume" Area) for radius = 0.5 0.021 [volume, area] - sphere_(radius); sphereVolume [sphereVolume volumel: sphereArea [sphereArea area) fprintf("%8.40 18.40 8.4dnradius, volume, area) end 24 25 26 minCylinderArea = min(cylinderArea); minSphereArea min(sphereArea); fprintf(" Minimum Cylinder Area *.4d ", minCylinderArea); fprintf("Minimum Sphere Area = 9.4d ", minSphereArea); In these exercises you will create vectors and plot them. For each plot, choose a suitable number of points to obtain a smooth curve. Include a grid along with appropriate x-axis and y-axis labels and a title. Also, use the data cursor to display the values at the minimum or maximum point on each plot. You do not need to create separate function files nor anonymous functions. Reminder: Array multiplication, division and exponentiation of vectors require the "dot" operators. For each problem, print out the script file and the plot. It is recommended you use Copy Figure and then paste into Word. Do not print out any vector values. 1. (30 points) Create vectors for radius, height and area for the cylindrical container with constant volume (see Lab 4). Plot the area vs. the ratio of diameter to height. Recall that the minimum area should correspond to height equal to diameter (i.e. twice the radius)
Step by Step Solution
There are 3 Steps involved in it

Get step-by-step solutions from verified subject matter experts