

Question: MATLAB HELP. NEED IT FAST Consider the following two functions, f(x) = e^-x sin(2x), g(x) = e^(-3/4 x) cos(2x). (a) Write a code to generate
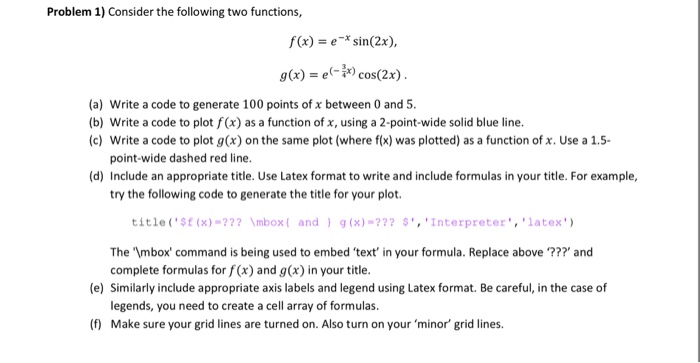
Consider the following two functions, f(x) = e^-x sin(2x), g(x) = e^(-3/4 x) cos(2x). (a) Write a code to generate 100 points of x between 0 and 5. (b) Write a code to plot f(x) as a function of x, using a 2-point-wide solid blue line. (c) Write a code to plot g(x) on the same plot (where f(x) was plotted) as a function of x. Use a 1.5- point-wide dashed red line. (d) Include an appropriate title. Use Latex format to write and include formulas in your title. For example, try the following code to generate the title for your plot. title('$f(x) = ??? \mbox (and) g(x) = ??? $', 'Interpreter', 'latex') The '\mbox' command is being used to embed 'text' in your formula. Replace above '???' and complete formulas for f(x) and g(x) in your title. (e) Similarly include appropriate axis labels and legend using Latex format. Be careful, in the case of legends, you need to create a cell array of formulas. (f) Make sure your grid lines are turned on. Also turn on your 'minor' grid lines
Step by Step Solution
There are 3 Steps involved in it

Get step-by-step solutions from verified subject matter experts