

Question: matlab help needed 8. (15 points) Write a script that plots distance vs. time for the data provided below. Adjust the format to display black
matlab help needed
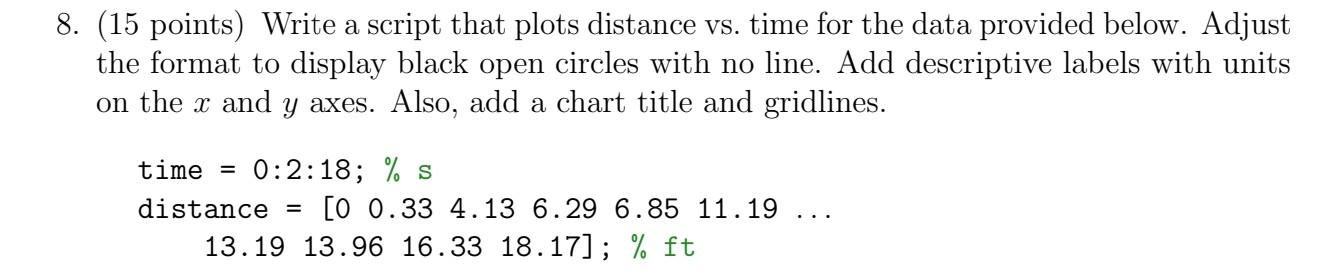
8. (15 points) Write a script that plots distance vs. time for the data provided below. Adjust the format to display black open circles with no line. Add descriptive labels with units on the x and y axes. Also, add a chart title and gridlines. time = 0:2:18; % s distance = [O 0.33 4.13 6.29 6.85 11.19 13.19 13.96 16.33 18.17]; % ft
Step by Step Solution
There are 3 Steps involved in it
1 Expert Approved Answer
Step: 1 Unlock

Question Has Been Solved by an Expert!
Get step-by-step solutions from verified subject matter experts
Step: 2 Unlock
Step: 3 Unlock