

Question: MATLAB HELP PLEASE 3. Basic Plotting Use Matlab to create the following plot with three subplots. All titles, gridlines, and axis labels should be as
MATLAB HELP PLEASE
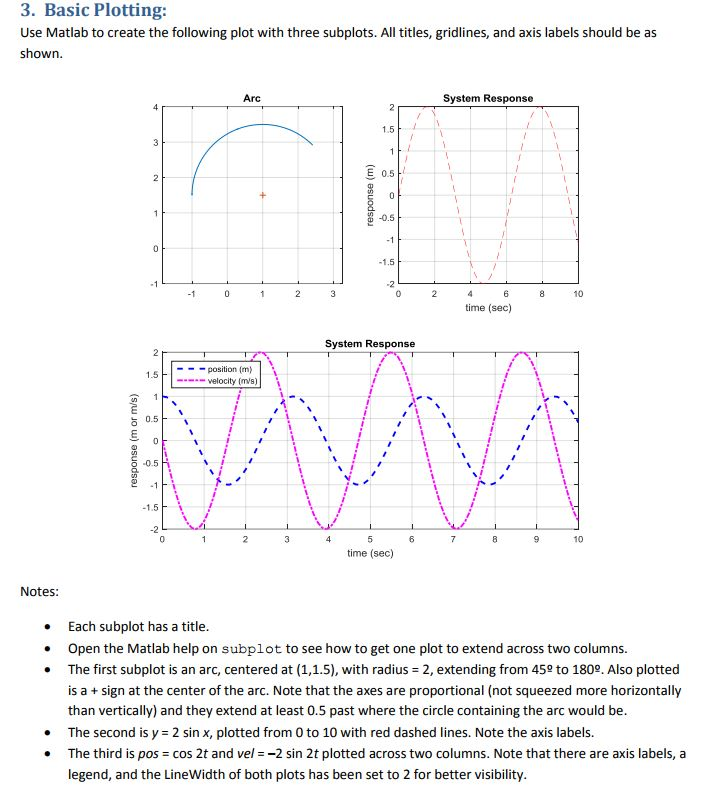
3. Basic Plotting Use Matlab to create the following plot with three subplots. All titles, gridlines, and axis labels should be as shown. Arc System Response 1.5 0.5 1.5 10 time (sec) System Response position (m) 1.5 |-|---.-velocity (mls) 0.5 1.5 -2 10 time (sec) Notes . Each subplot has a title . Open the Matlab help on subplot to see how to get one plot to extend across two columns. The first subplot is an arc, centered at (1,15), with radius = 2, extending from 452 to 180. Also plotted is a sign at the center of the arc. Note that the axes are proportional (not squeezed more horizontally than vertically)and they extend at least 0.5 past where the circle containing the arc would be The second is y= 2 sin x, plotted from 0 to 10 with red dashed lines. Note the axis labels. The third is pos = cos 2t and vel =-2 sin 2t plotted across two columns. Note that there are axis labels, a legend, and the LineWidth of both plots has been set to 2 for better visibility
Step by Step Solution
There are 3 Steps involved in it

Get step-by-step solutions from verified subject matter experts