

Question: MATLAB ICA 1: a) Using plot3, plot x, y and z given by the follow equations, for the range oft of 0.1, with R-10, r
MATLAB
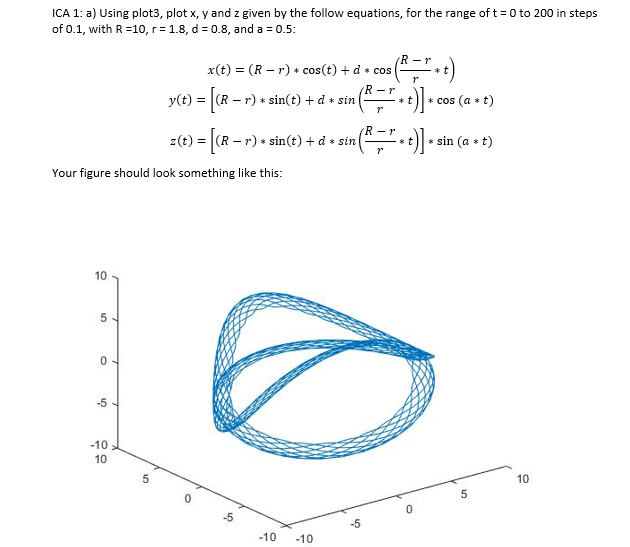
ICA 1: a) Using plot3, plot x, y and z given by the follow equations, for the range oft of 0.1, with R-10, r = 1.8, d :0.8, and a = 0.5: 0 to 200 in steps x(t) = (R-r) * cos (t) + d * cos R -r r.r) . y(t) = |(R _ r) * sin(t) + d * sin (__ * t)|*cos (a * t) 2(t) = [A-r) * sin(t) + d * sin (--* t)| * sin (a * t) Your figure should look something like this 10 0 -5 -10 10 10 0 -5 -5 -10 -10
Step by Step Solution
There are 3 Steps involved in it
1 Expert Approved Answer
Step: 1 Unlock

Question Has Been Solved by an Expert!
Get step-by-step solutions from verified subject matter experts
Step: 2 Unlock
Step: 3 Unlock