

Question: Matlab. In this exercise, you have to consider the Table 1 below and create plots with the appropriate x range and title. x range plot
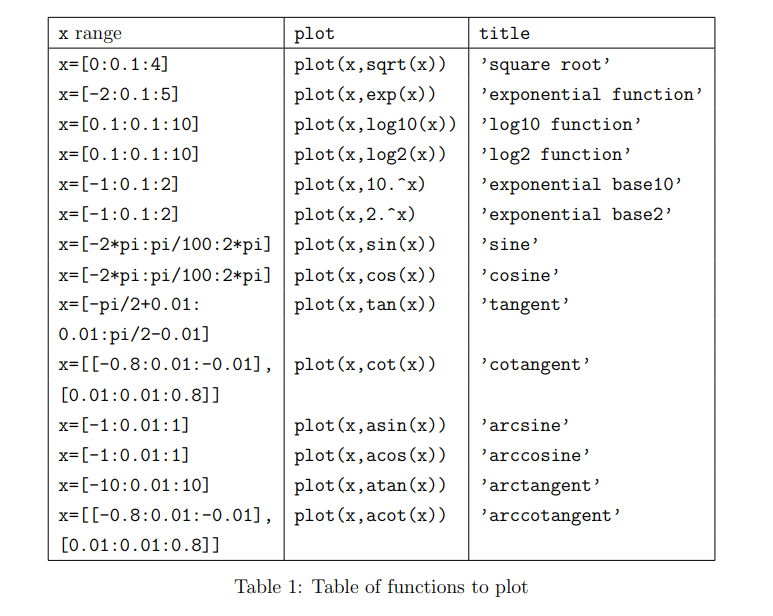
Matlab. In this exercise, you have to consider the Table 1 below and create plots with the appropriate x range and title.
![plot title x=[0:0.1:4] plot(x,sqrt(x)) 'square root' x=(-2:0.1:5] plot(x,exp(x)) exponential function' x=[0.1:0.1:10] plot(x,](https://dsd5zvtm8ll6.cloudfront.net/si.experts.images/questions/2024/09/66f39aaf04df6_87866f39aae81ba6.jpg)
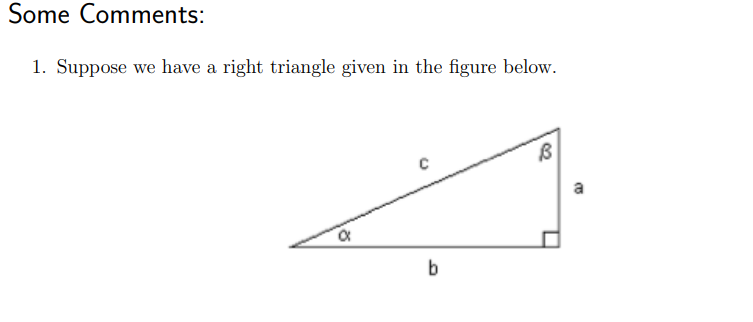
x range plot title x=[0:0.1:4] plot(x,sqrt(x)) 'square root' x=(-2:0.1:5] plot(x,exp(x)) exponential function' x=[0.1:0.1:10] plot(x, log10(x)) 'log10 function' x=[0.1:0.1:10] plot (x, log2 (x)) log2 function' x=(-1:0.1:2] plot(x,10.^x) 'exponential base 10' x=(-1:0.1:2] plot(x, 2.^x) 'exponential base2' x=[-2*pi:pi/100:2*pi) plot(x,sin(x)) 'sine' x=[-2*pi:pi/100:2*pi) plot(x,cos(x)) cosine' x=(-pi/2+0.01: plot(x, tan(x)) 'tangent' 0.01:pi/2-0.01] x=[(-0.8:0.01:-0.01], plot(x,cot (x)) 'cotangent' [0.01:0.01:0.8]] x=(-1:0.01:1] plot(x, asin(x)) 'arcsine' x=(-1:0.01:1] plot(x, acos(x)) 'arccosine x=(-10:0.01:10] plot(x,atan(x)) 'arctangent' x=[(-0.8:0.01:-0.01], plot(x, acot(x)) 'arccotangent' [0.01:0.01:0.8]] Table 1: Table of functions to plot Some Comments: 1. Suppose we have a right triangle given in the figure below. B a b Then we can define sin, cos, tan and cot as: a sin(a) = b cos(a) opposite side hypotenuse adjacent side hypotenuse opposite side adjacent side adjacent side opposite side a tan(a) b b cot(a) a 2. Note that tan(-1/2) is - while the tan(+A/2) is too. Thus we take the domain of tan(2) not to be x=[-\pi/2:0.01:\pi/2] but rather x= [-\pi/2+0.01:0.01:\pi/2-0.01] to avoid the o problem. 3. If x = sin(y) then y = sin-|(2) = asin(2). If x = cos(y) then y=cos(x) = acos(x). If x = tan(y) then y = tan-'(x) = atan(2). If x = cot(y) then y = cot-1(2) = acot(x). 4. Note that x = [-pi/2:pi/100:pi/2); plot(x,cot(x)) would give a warning of di- vision by zero. The reason for this result is that, when x + 0, cot(2) + o as tan(0) 2 = 0 and cot(x) = 1/tan(x). The cotangent plot above effectively has 2 do- mains with x1=(-0.8:0.01:-0.01) and x2=[0.01:0.01:0.8]. Then x=[x1, x2] joins the two domains define by x1 and x2 into a single domain. This avoids the zero division problem. Of course x=[(-0.8:0.01:-0.01), (0.01:0.01:0.8]] is equivalent
Step by Step Solution
There are 3 Steps involved in it

Get step-by-step solutions from verified subject matter experts