

Question: MATLAB Insert the code above on the Matlab Plot the I vs phi output graph. The output graph of the code above would not show
MATLAB
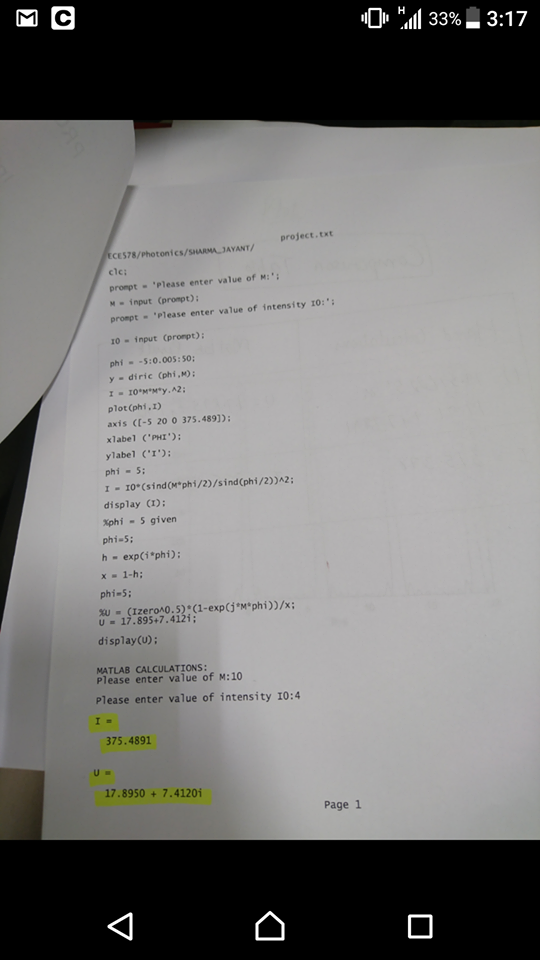
Insert the code above on the Matlab Plot the I vs phi output graph.
The output graph of the code above would not show on my matlab.
please help debug if theres any.
M C project txt cES78/ photonics/ YANT/ prompt Please enter value of Mt M input (prompt): intensity IO: Please enter value of prompt 10 input (prompt): phi 5.0.005: 50 y diric (phi. M): plot (phi,I) axis (C-5 200 0 375.489]): xlabel ('PHI'); ylabel ('I'): phi 5: I IO*(sind CM phi/2)/sind(phi/2))A2; display (I): xphi 5 given phi 5: h exp(i phi) x 1-h (IzeroA0.5) (1-exp M phi ))/x: U 17.895+7.412 display (U); MATLAB CALCULATIONS Please enter value of M:10 Please enter value of intensity I0:4 375.4891 17.8950 7.4120i Page 1 Hill 33% 3:17
Step by Step Solution
There are 3 Steps involved in it

Get step-by-step solutions from verified subject matter experts