

Question: (MATLAB ONLY)(MATLAB ONLY)(MATLAB ONLY)(MATLAB ONLY)(MATLAB ONLY)(MATLAB ONLY)(MATLAB ONLY)(MATLAB ONLY)(MATLAB ONLY)(MATLAB ONLY)(MATLAB ONLY)(MATLAB ONLY)(MATLAB ONLY)(MATLAB ONLY)(MATLAB ONLY)(MATLAB ONLY)(MATLAB ONLY)(MATLAB ONLY)(MATLAB ONLY)(MATLAB ONLY)(MATLAB ONLY)(MATLAB ONLY)(MATLAB ONLY)(MATLAB ONLY)(MATLAB
(MATLAB ONLY)(MATLAB ONLY)(MATLAB ONLY)(MATLAB ONLY)(MATLAB ONLY)(MATLAB ONLY)(MATLAB ONLY)(MATLAB ONLY)(MATLAB ONLY)(MATLAB ONLY)(MATLAB ONLY)(MATLAB ONLY)(MATLAB ONLY)(MATLAB ONLY)(MATLAB ONLY)(MATLAB ONLY)(MATLAB ONLY)(MATLAB ONLY)(MATLAB ONLY)(MATLAB ONLY)(MATLAB ONLY)(MATLAB ONLY)(MATLAB ONLY)(MATLAB ONLY)(MATLAB ONLY)(MATLAB ONLY)(MATLAB ONLY)(MATLAB ONLY)(MATLAB ONLY)(MATLAB ONLY)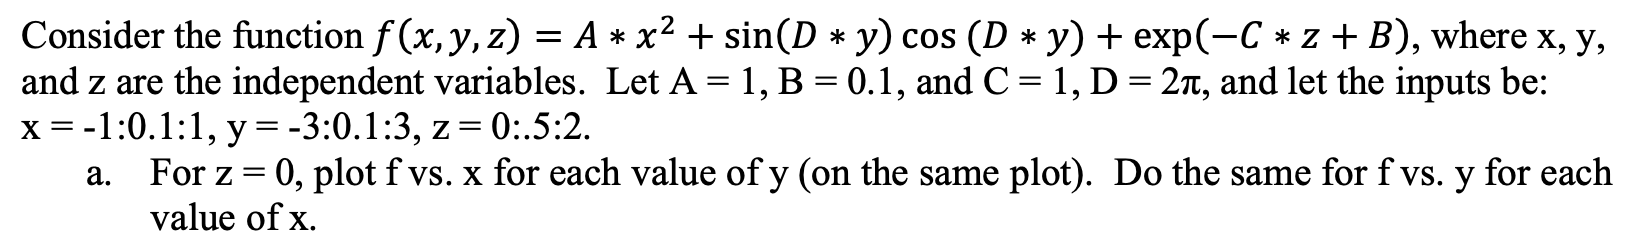
Consider the function f(x,y,z) = A * x2 + sin(D * y) cos (D * y) + exp(-C*z+B), where x, y, and z are the independent variables. Let A = 1, B = 0.1, and C = 1, D = 27, and let the inputs be: x=-1:0.1:1, y=-3:0.1:3, z=0:.5:2. For z= 0, plot f vs. x for each value of y (on the same plot). Do the same for f vs. y for each value of x. a. Consider the function f(x,y,z) = A * x2 + sin(D * y) cos (D * y) + exp(-C*z+B), where x, y, and z are the independent variables. Let A = 1, B = 0.1, and C = 1, D = 27, and let the inputs be: x=-1:0.1:1, y=-3:0.1:3, z=0:.5:2. For z= 0, plot f vs. x for each value of y (on the same plot). Do the same for f vs. y for each value of x. a
Step by Step Solution
There are 3 Steps involved in it

Get step-by-step solutions from verified subject matter experts