

Question: MATLAB Plot and Function 4. Provide your commands to make a plot animation of the following data in the order that it appears. Each data
MATLAB 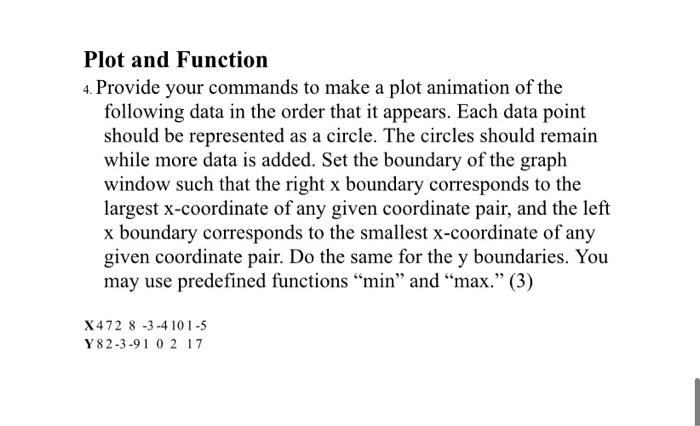
Plot and Function 4. Provide your commands to make a plot animation of the following data in the order that it appears. Each data point should be represented as a circle. The circles should remain while more data is added. Set the boundary of the graph window such that the right x boundary corresponds to the largest x-coordinate of any given coordinate pair, and the left x boundary corresponds to the smallest x-coordinate of any given coordinate pair. Do the same for the y boundaries. You may use predefined functions "min" and "max." (3) X472 8 -3 -4 101-5 Y82-3-91 0 2 17
Step by Step Solution
There are 3 Steps involved in it
1 Expert Approved Answer
Step: 1 Unlock

Question Has Been Solved by an Expert!
Get step-by-step solutions from verified subject matter experts
Step: 2 Unlock
Step: 3 Unlock