

Question: Matlab Plot each of the functions below for the indicated time interval over the same figure. Attach plots with your report. Distinguish using color or
 Matlab
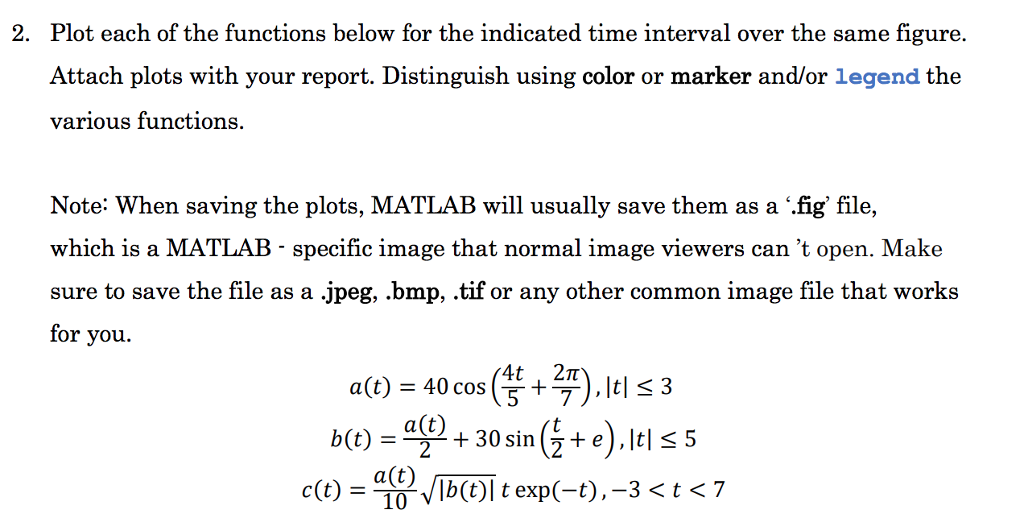
Plot each of the functions below for the indicated time interval over the same figure. Attach plots with your report. Distinguish using color or marker and/or legend the various functions. 2. Note: When saving the plots, MATLAB will usually save them as a '.fig file, which is a MATLAB - specific image that normal image viewers can 't open. Make sure to save the file as a .jpeg, .bmp, .tif or any other common image file that works for you. a (t) = 40 cos 2. b-+30sin+ e).ss +).lt! 3 a(t) a(t) 10
Step by Step Solution
There are 3 Steps involved in it
1 Expert Approved Answer
Step: 1 Unlock

Question Has Been Solved by an Expert!
Get step-by-step solutions from verified subject matter experts
Step: 2 Unlock
Step: 3 Unlock