

Question: Matlab Plotting Help Step 1: Understanding the problem Amplitude modulation (AM) is a modulation technique used in electronic communication most commonly for transmitting information via
Matlab Plotting Help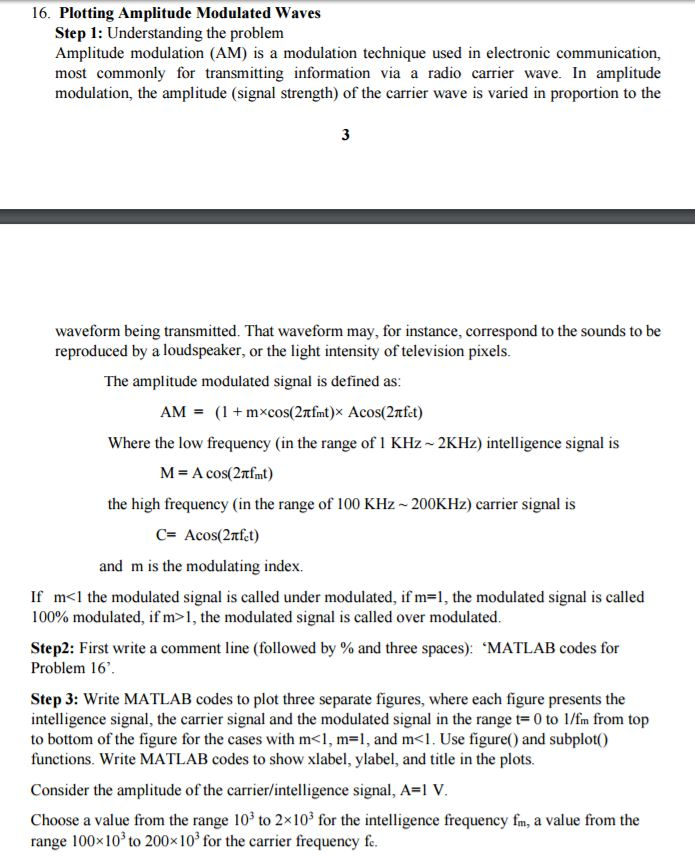
Step 1: Understanding the problem Amplitude modulation (AM) is a modulation technique used in electronic communication most commonly for transmitting information via a radio carrier wave. In amplitude modulation, the amplitude (signal strength) of the carrier wave is varied in proportion to the waveform being transmitted. That waveform may, for instance, correspond to the sounds to be reproduced by a loudspeaker, or the light intensity of television pixels. The amplitude modulated signal is defined as: AM = (1 + m times cos (2 pi f_m t) times A cos (2 pi f_c t) Where the low frequency (in the range of 1 KHz ~ 2KHz) intelligence signal is M = A cos(2 pi f_mt) the high frequency (in the range of 100 KHz ~ 200KHz) carrier signal is C = A cos(2 pi f_c t) and m is the modulating index. If m 1, the modulated Step2: First write a comment line (followed by % and three spaces): MATLAB codes for Problem 16 Step 3: Write MATLAB codes to plot three separate figures, where each figure presents the intelligence signal, the carrier signal and the modulated signal in the range t = 0 to l/f_m from top to bottom of the figure for the cases with m
Step by Step Solution
There are 3 Steps involved in it

Get step-by-step solutions from verified subject matter experts