

Question: Matlab pls the answer Question3: Generate a figure with 2 x 2 array of windows. In the 4 windows graph the following 4 functions over
Matlab pls the answer
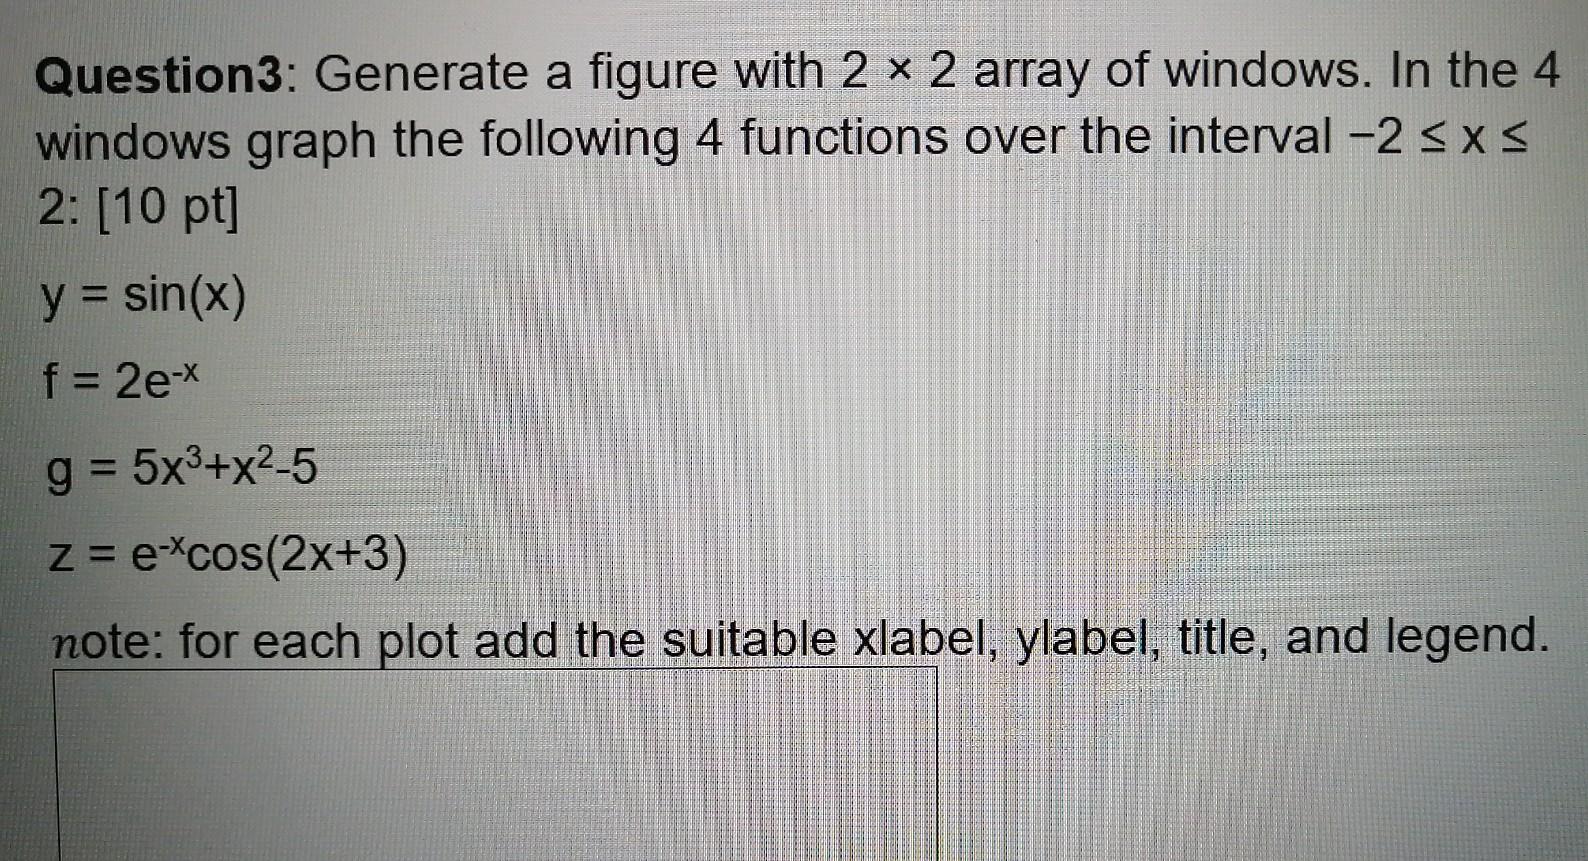
Question3: Generate a figure with 2 x 2 array of windows. In the 4 windows graph the following 4 functions over the interval -2 sxs 2: (10 pt] y = sin(x) f= 2e-X g = 5x3+x2-5 z= e-*cos(2x+3) note: for each plot add the suitable xlabel, ylabel, title, and legend
Step by Step Solution
There are 3 Steps involved in it
1 Expert Approved Answer
Step: 1 Unlock

Question Has Been Solved by an Expert!
Get step-by-step solutions from verified subject matter experts
Step: 2 Unlock
Step: 3 Unlock