

Question: Matlab problem c) Plot the interpolation polynomial by sg pLot on te odespace m T, x e [-1,1], we want to interpolate this function on
Matlab problem 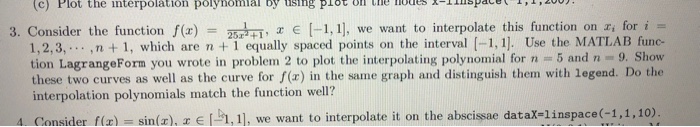
c) Plot the interpolation polynomial by sg pLot on te odespace m T, x e [-1,1], we want to interpolate this function on x, for i onsider the function f(x) = 1,2,3,... ,n 1, which are n 1 equally spaced points on the interval [-1, 1]. Use the MATLAB func- tion LagrangeForm you wrote in problem 2 to plot the interpolating polynomial for n 5 and n 9. Show these two curves as well as the curve for f(x) in the same graph and distinguish them with legend. Do the interpolation polynomials match the function well? 3. C 1. Consider. f(x) = sin(x), x E [, 11, we want to interpolate it on the abscissae data-linspace (-1,1,10)
Step by Step Solution
There are 3 Steps involved in it
1 Expert Approved Answer
Step: 1 Unlock

Question Has Been Solved by an Expert!
Get step-by-step solutions from verified subject matter experts
Step: 2 Unlock
Step: 3 Unlock