

Question: MATLAB PROBLEM: This question is concerned with plotting functions. Plot the following functions over the range 0 s x 4. The resulting graphs should look
MATLAB PROBLEM:
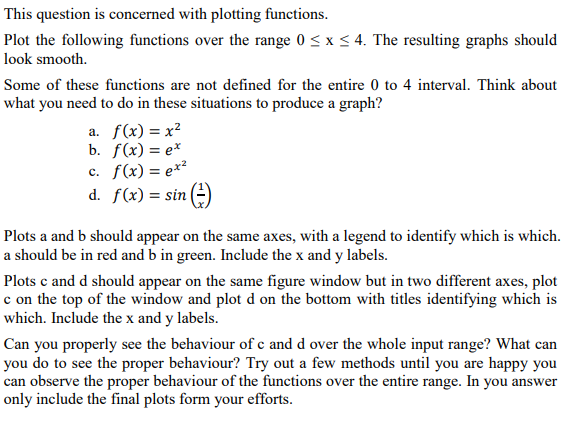
This question is concerned with plotting functions. Plot the following functions over the range 0 s x 4. The resulting graphs should look smooth. Some of these functions are not defined for the entire 0 to 4 interval. Think about what you need to do in these situations to produce a graph? a. f(x)-x2 b. f(x) e c. fx)e* Plots a and b should appear on the same axes, with a legend to identify which is whiclh a should be in red and b in green. Include the x and y labels Plots c and d should appear on the same figure window but in two different axes, plot c on the top of the window and plot d on the bottom with titles identifying which is which. Include the x and y labels Can you properly see the behaviour of c and d over the whole input range? What can you do to see the proper behaviour? Try out a few methods until you are happy you can observe the proper behaviour of the functions over the entire range. In you answer only include the final plots form your efforts
Step by Step Solution
There are 3 Steps involved in it

Get step-by-step solutions from verified subject matter experts