

Question: Matlab Programming Construction of Temperature Profiles by Least Squares Polynomials Among the important inputs in weather-forecasting models are data sets consisting of temperature values at
Matlab Programming
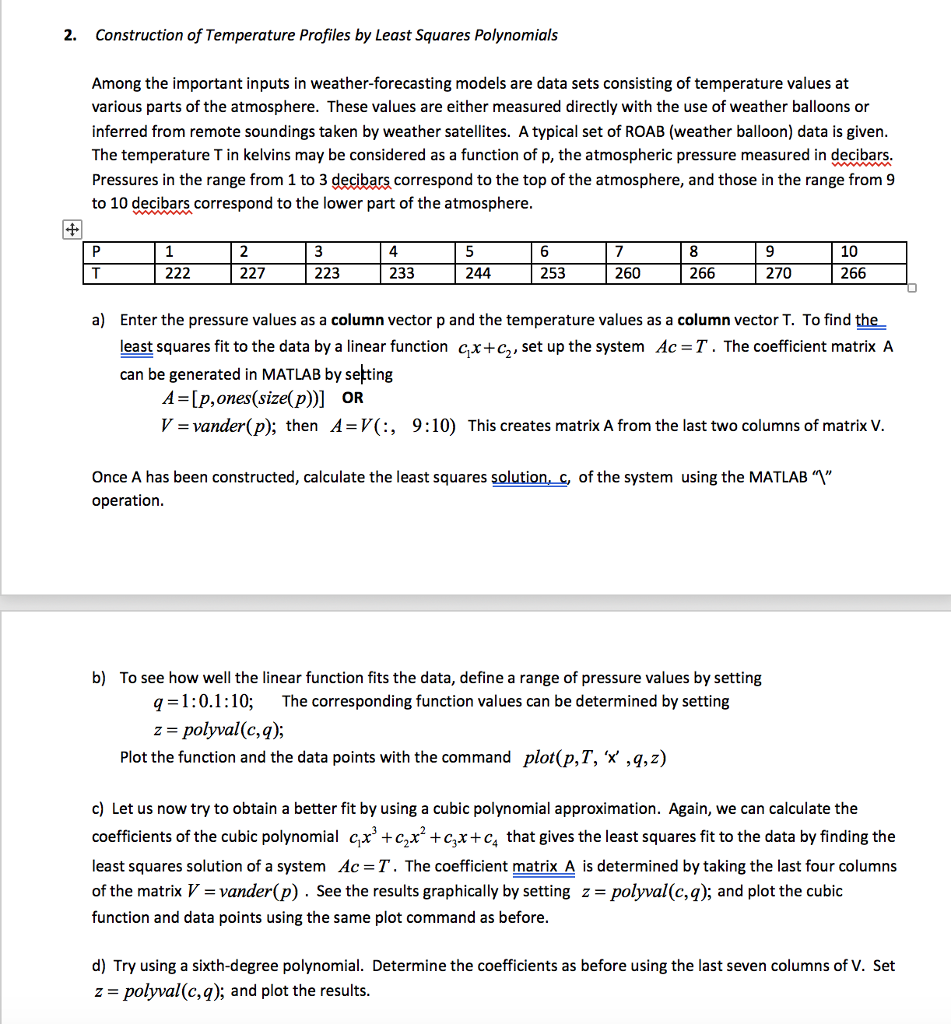
Construction of Temperature Profiles by Least Squares Polynomials Among the important inputs in weather-forecasting models are data sets consisting of temperature values at various parts of the atmosphere. These values are either measured directly with the use of weather balloons or inferred from remote soundings taken by weather satellites. A typical set of ROAB (weather balloon) data is given. The temperature T in kelvins may be considered as a function of p, the atmospheric pressure measured in decibars Pressures in the range from 1 to 3 decibars correspond to the top of the atmosphere, and those in the range from 9 to 10 decibars correspond to the lower part of the atmosphere. a) Enter the pressure values as a column vector p and the temperature values as a column vector T. To find the least squares fit to the data by a linear function c_1 x + c_2, set up the system Ac = T. The coefficient matrix A can be generated in MATLAB by setting A = [p, ones (size(p))] OR V = vander(p): then A = V(:, 9: 10) This creates matrix A from the last two columns of matrix V. Once A has been constructed, calculate the least squares solution, c, of the system using the MATLAB "\" operation. b) To see how well the linear function fits the data
Step by Step Solution
There are 3 Steps involved in it

Get step-by-step solutions from verified subject matter experts