

Question: Matlab Question: How center align the labels with each bar on the histogram plot in Matlab and provide spacing in between? My code is as
Matlab Question: How center align the labels with each bar on the histogram plot in Matlab and provide spacing in between?
My code is as follows:
x = randi([0 253], 1, 100); figure; hist(x,7) set(gca,'XTickLabel',{'1,S', '2,TS', '3,H1', '4,H2', '5,H3', '6,H4','7,H5'}) xlabel('Category of Storm') ylabel('Number of Storm Occurrences') 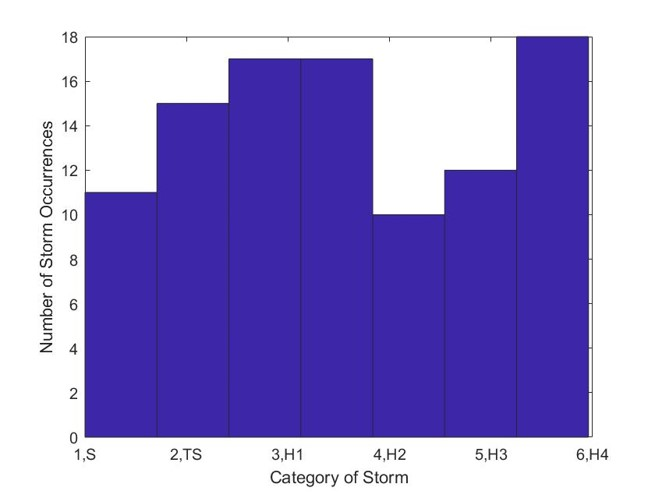
As you can see, the labels do not align with the bars. Please help!
18 16 1 4 12 O 10 8 6 2 9 1,S 2,TS 3,H1 Category of Storm 4,H2 5,H3 6,H4
Step by Step Solution
There are 3 Steps involved in it
1 Expert Approved Answer
Step: 1 Unlock

Question Has Been Solved by an Expert!
Get step-by-step solutions from verified subject matter experts
Step: 2 Unlock
Step: 3 Unlock