

Question: matlab question i need to plot this in matlab 7. (20 points) A Gaussian probability density function is represented as: g(x) = Croize-(2-/202, where him
matlab question 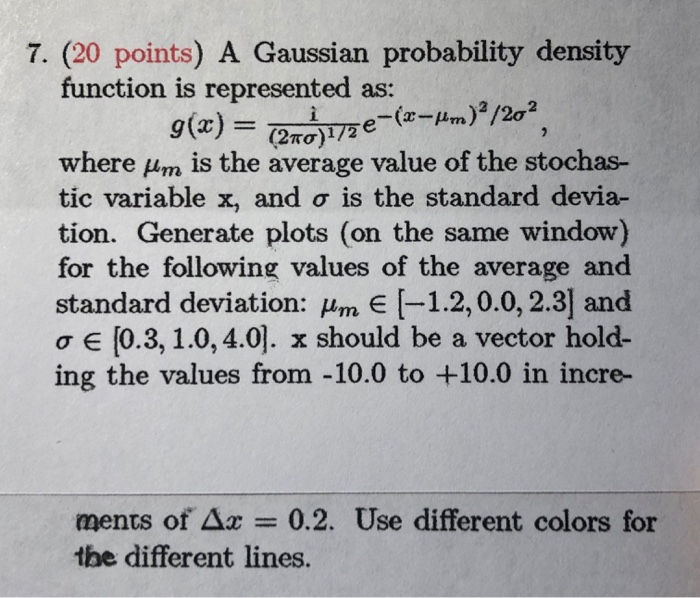
i need to plot this in matlab
7. (20 points) A Gaussian probability density function is represented as: g(x) = Croize-(2-/202, where him is the average value of the stochas- tic variable x, and o is the standard devia- tion. Generate plots (on the same window) for the following values of the average and standard deviation: um -1.2,0.0, 2.3) and o (0.3, 1.0, 4.0). x should be a vector hold- ing the values from -10.0 to +10.0 in incre- ments of Ax = 0.2. Use different colors for the different lines
Step by Step Solution
There are 3 Steps involved in it
1 Expert Approved Answer
Step: 1 Unlock

Question Has Been Solved by an Expert!
Get step-by-step solutions from verified subject matter experts
Step: 2 Unlock
Step: 3 Unlock