

Question: matlab question Part 3: Plot a sum of sine waves In this section you will create a Matlab file that generates two separate sine waves
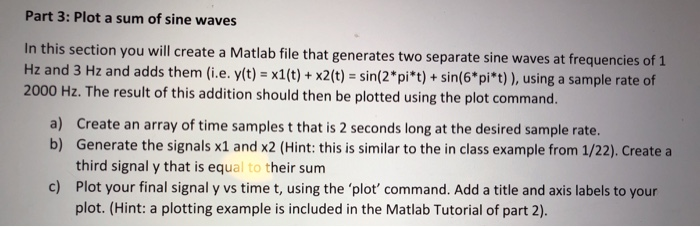
Part 3: Plot a sum of sine waves In this section you will create a Matlab file that generates two separate sine waves at frequencies of 1 Hz and 3 Hz and adds them (i.e. y(t) = x1(t) + x2(t) = sin(2*pi*t) + sin(6*pi*t)), using a sample rate of 2000 Hz. The result of this addition should then be plotted using the plot command. a) Create an array of time samples t that is 2 seconds long at the desired sample rate. b) Generate the signals x1 and 2 (Hint: this is similar to the in class example from 1/22). Create a third signal y that is equal to their sum c) Plot your final signal y vs time t, using the 'plot' command. Add a title and axis labels to your plot. (Hint: a plotting example is included in the Matlab Tutorial of part 2)
Step by Step Solution
There are 3 Steps involved in it

Get step-by-step solutions from verified subject matter experts