

Question: MATLAB Surface plots Plot the surface generated by Z = sin(x)cos(x)e^-- squareroot x^2 + y^2 over the domain x [-3, 3] and y [-3, 3J.
MATLAB 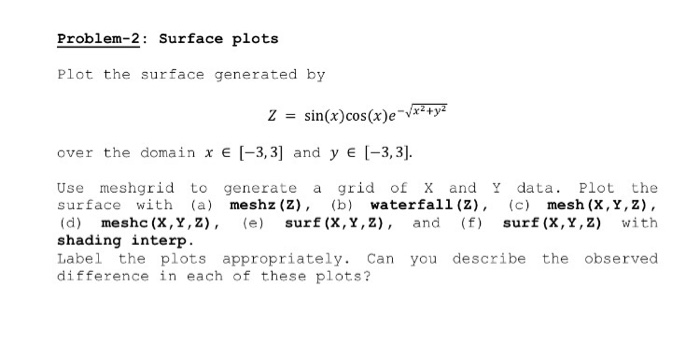
Surface plots Plot the surface generated by Z = sin(x)cos(x)e^-- squareroot x^2 + y^2 over the domain x [-3, 3] and y [-3, 3J. Use meshgrid to generate a grid of X and Y data. Plot the surface with meshz(Z), waterfall(Z), mesh(X, Y, Z), meshc(X, Y, Z), surf(X, Y, Z), and surf(X, Y, Z) with shading interp. Label the plots appropriately. Can you describe the observed difference in each of these plots
Step by Step Solution
There are 3 Steps involved in it
1 Expert Approved Answer
Step: 1 Unlock

Question Has Been Solved by an Expert!
Get step-by-step solutions from verified subject matter experts
Step: 2 Unlock
Step: 3 Unlock