

Question: MATLAB Survey Engr Apps Mathematics Section 01 Fall Semester 2017 co ENNESAW E UNIVERSITY u content Discussions Assignments nts Lecture 11 Lecture 11-In Class Exercise
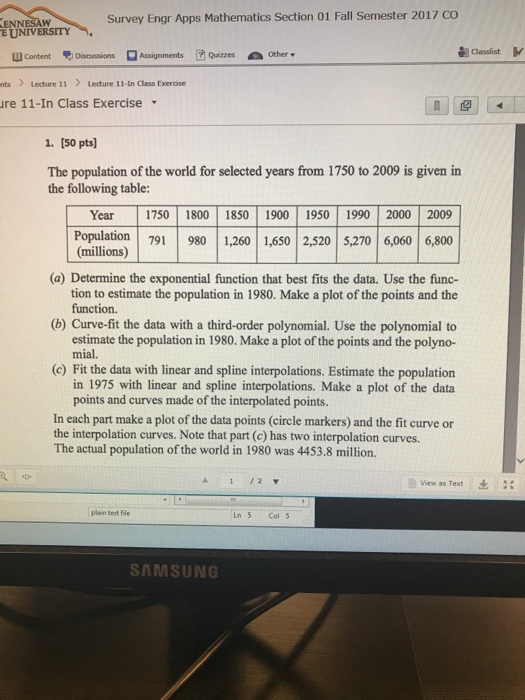

Survey Engr Apps Mathematics Section 01 Fall Semester 2017 co ENNESAW E UNIVERSITY u content Discussions Assignments nts Lecture 11 Lecture 11-In Class Exercise re 11-In Class Exercise Qazes Aote" 1. (50 pts The population of the world for selected years from 1750 to 2009 is given in the following table: Year 1750 1800 1850 1900 1950 1990 2000 2009 Population 791 980 1,260 6502,520 5,270 6,060 6,800 (millions) (a) Determine the exponential function that best fits the data. Use the func- (b) Curve-fit the data with a third-order polynomial. Use the polynomial to (c) Fit the data with linear and spline interpolations. Estimate the population tion to estimate the population in 1980. Make a plot of the points and the function. estimate the population in 1980. Make a plot of the points and the polyno- mial. in 1975 with linear and spline interpolations. Make a plot of the data points and curves made of the interpolated points. In each part make a plot of the data points (circle markers) and the fit curve or the interpolation curves. Note that part (c) has two interpolation curves. The actual population of the world in 1980 was 4453.8 million. 12 View as Text plain text fle Ln 5 Col 5 SAMSUNG
Step by Step Solution
There are 3 Steps involved in it

Get step-by-step solutions from verified subject matter experts