

Question: Matlab This code takes too many time to execute, i think the problem is on the for loop. Please fix it. kos file: https://mega.nz/#!AqoAiA6I!WdYRV8HIqsQ-ZESw08tbScWKe6CH4iZN7tgNfuz9jt4 data-readtable
Matlab
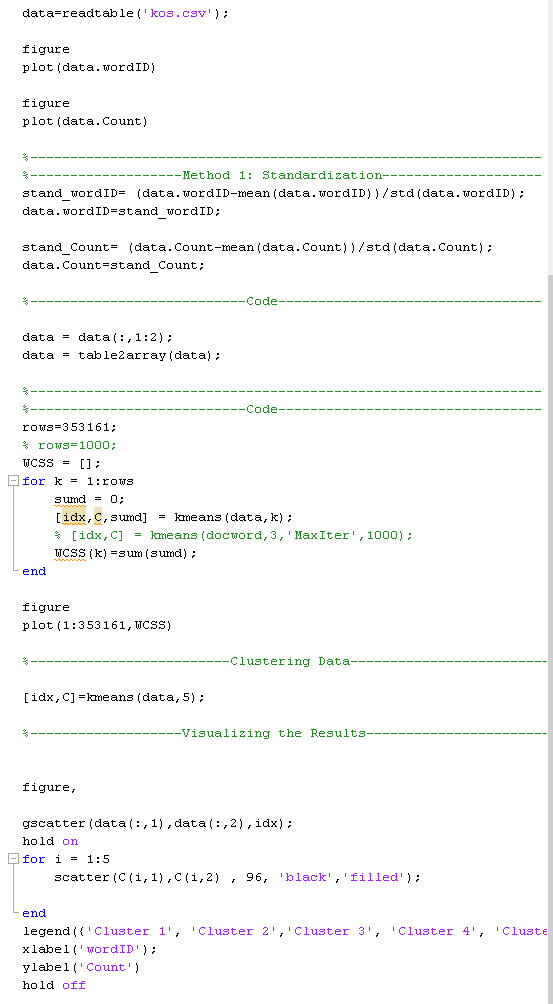
This code takes too many time to execute, i think the problem is on the for loop. Please fix it.
kos file:
https://mega.nz/#!AqoAiA6I!WdYRV8HIqsQ-ZESw08tbScWKe6CH4iZN7tgNfuz9jt4
data-readtable ('kos.csv'); figure plot (data. wordID) figure plot (data.Count) Method 1: Standardization stand wordID (data.wordID-mean (data.wordID))/std (data.wordID) data. wordID-stand wordID; stand Count= (data. Count-mean (data. Count ))/std (data. Count); data. Count-stand Count; Code data data data(:,1:2): table2 array (data); Code rows-353161: rowS- 1000: WCSS = []; for k-1:rows sured = 0 [idx, C, sumd] -kmeans (data, k); [idx,C) = kmeans (docword, 3,' Max Iter',1000); WCSS (k) -sum (sumd): end figure plot (1:353161, WCSS) Clustering Data [idx,C] -kmeans (data, 5) Visualizing the Results figure, gscatter (data(:,1),data(:,2),idx); hold on for i 1:5 scatter (C(i,1), C(i,2) , 96, 'black','filled') : end legend(f Cluster 1', Cluster 2', 'Cluster 3', xlabel('wordID: ylabel(' Count') hold off 'Cluster 4, 'Cluste
Step by Step Solution
There are 3 Steps involved in it

Get step-by-step solutions from verified subject matter experts