

Question: Matlab: Using Interpolation Function Working on this project that I have posted below, I have also attached my code so far, I just wanted to
Matlab: Using Interpolation Function
Working on this project that I have posted below, I have also attached my code so far, I just wanted to know if I was interpolating correctly? And also any advice on how to make the code better, or if you notice any mistakes. Thanks!
temp = [0.01; 10; 20; 30; 40; 50; 60; 70; 80; 90; 100; 110; 120]; pSat = [0.6; 1.2;2.3;4.2;7.4;12.4;20.0;31.2;47.4;70.2;101.4;143.4;198.7]; vSat = [206.0;106.3;57.7;32.9;19.5;12.0;7.7;5.0;3.4;2.4;1.7;1.2;0.9]; t = linspace(min(temp),max(temp),100); zoomT = linspace(60,90,4); interTemp = interp1(temp,vSat,t); zoomInterTemp = interp1(temp,vSat,zoomT);
subplot(1,2,1); plot(temp,vSat,'ko'); hold on plot(t,interTemp,'ro'); xlabel('Temperature'); ylabel('Saturated Vapor Volume'); title('Full Range');
subplot(1,2,2); plot(temp(7:10),vSat(7:10),'ko'); hold on plot(zoomT,zoomInterTemp,'ro'); xlabel('Temperature'); ylabel('Saturated Vapor Volume'); title('Zoomed In');
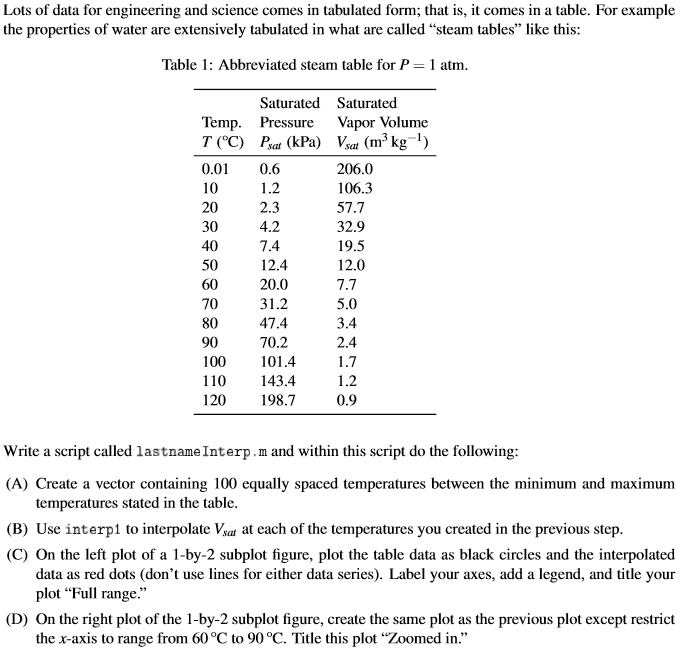
Lots of data for engineering and science comes in tabulated form; that is, it comes in a table. For example the properties of water are extensively tabulated in what are called "steam tables" like this Table 1: Abbreviated steam table for P 1 atm Saturated Saturated Temp. Pressure Vapor Volume 0.0 0.6 20 30 40 50 60 70 80 90 100 101.4 110 143.4 120 198.7 2.3 4.2 7.4 12.4 20.0 31.2 47.4 70.2 206.0 106.3 57.7 32.9 19.5 12.0 7.7 5.0 3.4 2.4 1.2 0.9 Write a script called lastnameInterp.m and within this script do the following (A) Create a vector containing 100 equally spaced temperatures between the minimum and maximum (B) Use interp1 to interpolate Vsat at each of the temperatures you created in the previous step temperatures stated in the table (C) On the left plot of a 1-by-2 subplot figure, plot the table data as black circles and the interpolated data as red dots (don't use lines for either data series). Label your axes, add a legend, and title your plot "Full range." (D) On the right plot of the 1-by-2 subplot figure, create the same plot as the previous plot except restrict the x-axis to range from 60 C to 90C. Title this plot "Zoomed in
Step by Step Solution
There are 3 Steps involved in it

Get step-by-step solutions from verified subject matter experts