

Question: *MATLAB* Write a GUI function to plot any user entered 1D function as shown below. User uses the edit text box to enter a function,
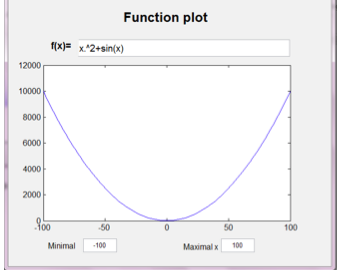
*MATLAB* Write a GUI function to plot any user entered 1D function as shown below. User uses the edit text box to enter a function, then hits the enter key to plot it in the axes window. Then add two edit box controls to change the range of the x-axis. The minimal x has an initial value of 0; whereas the maximal x has an initial value of 100. Change their values and enter the return key will update the plot with new axis limit.
Step by Step Solution
There are 3 Steps involved in it
1 Expert Approved Answer
Step: 1 Unlock

Question Has Been Solved by an Expert!
Get step-by-step solutions from verified subject matter experts
Step: 2 Unlock
Step: 3 Unlock