

Question: May I get some assistance with completing this exercise: Capacity Analysis Being able to analyze plant and equipment (capacity and automation) is essential to understanding
May I get some assistance with completing this exercise:
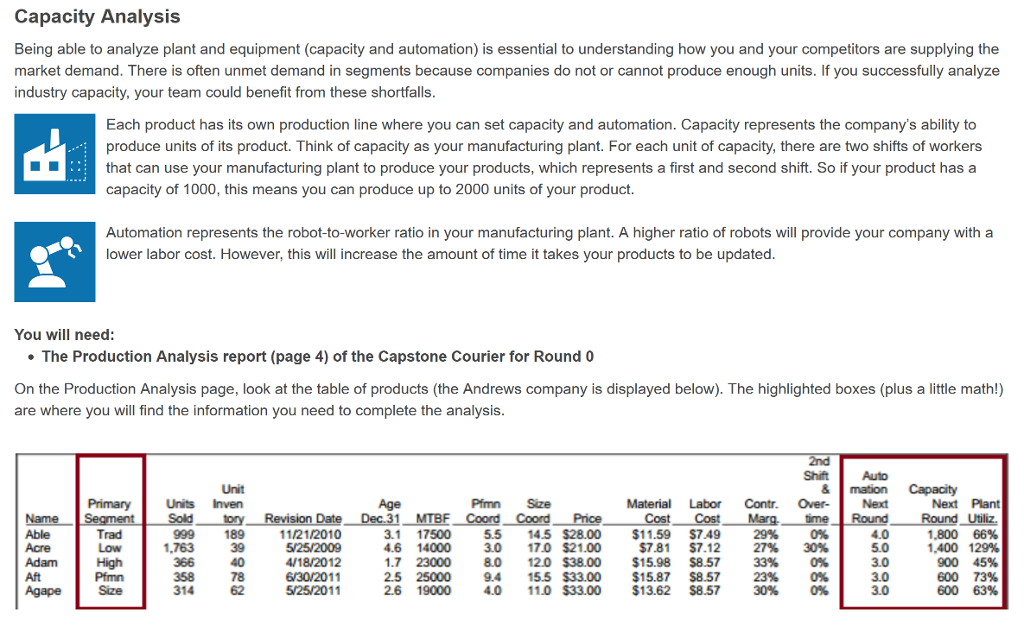
Capacity Analysis Being able to analyze plant and equipment (capacity and automation) is essential to understanding how you and your competitors are supplying the market demand. There is often unmet demand in segments because companies do not or cannot produce enough units. If you successfully analyze industry capacity, your team could benefit from these shortfalls Each product has its own production line where you can set capacity and automation. Capacity represents the company's ability to produce units of its product. Think of capacity as your manufacturing plant. For each unit of capacity, there are two shifts of workers that can use your manufacturing plant to produce your products, which represents a first and second shift. So if your product has a capacity of 1000, this means you can produce up to 2000 units of your product. Automation represents the robot-to-worker ratio in your manufacturing plant. A higher ratio of robots will provide your company with a lower labor cost. However, this wil increase the amount of time it takes your products to be updated You will need: The Production Analysis report (page 4) of the Capstone Courier for Round 0 On the Production Analysis page, look at the table of products (the Andrews company is displayed below). The highlighted boxes (plus a little math!) are where you will find the information you need to complete the analysis ShiftAuto &mation Capacity Unit Units Inven Primary Pfmn Size Material Labor Contr. Over Next Next Plant Nae Segment Able Acre AdamLow Aft 1,800 66% 1,400 129% 900 45% 600 73% 600 63% Trad 999 1,763 189 39 40 78 62 11/21/2010 3.117500 5.5 14.5 $28.00 $11.59 $7.49 4.6 14000 3.0 17.0 S21.00 1.723000 80 12.0$38.00 $15.98 $8.57 2.5 25000 9.4 15.5 $33.00 $15.87 $8.57 2.6 19000 4.0 11.0 $33.00 $13.62 $8.57 29% 27% 33% 23% 30% 0% 30% 0% 0% 0% 4.0 5.0 3.0 3.0 3.0 $7.81 $7.12 358 314 4/18/2012 6/30V2011 5/25/2011 AgapePmn Capacity Analysis Being able to analyze plant and equipment (capacity and automation) is essential to understanding how you and your competitors are supplying the market demand. There is often unmet demand in segments because companies do not or cannot produce enough units. If you successfully analyze industry capacity, your team could benefit from these shortfalls Each product has its own production line where you can set capacity and automation. Capacity represents the company's ability to produce units of its product. Think of capacity as your manufacturing plant. For each unit of capacity, there are two shifts of workers that can use your manufacturing plant to produce your products, which represents a first and second shift. So if your product has a capacity of 1000, this means you can produce up to 2000 units of your product. Automation represents the robot-to-worker ratio in your manufacturing plant. A higher ratio of robots will provide your company with a lower labor cost. However, this wil increase the amount of time it takes your products to be updated You will need: The Production Analysis report (page 4) of the Capstone Courier for Round 0 On the Production Analysis page, look at the table of products (the Andrews company is displayed below). The highlighted boxes (plus a little math!) are where you will find the information you need to complete the analysis ShiftAuto &mation Capacity Unit Units Inven Primary Pfmn Size Material Labor Contr. Over Next Next Plant Nae Segment Able Acre AdamLow Aft 1,800 66% 1,400 129% 900 45% 600 73% 600 63% Trad 999 1,763 189 39 40 78 62 11/21/2010 3.117500 5.5 14.5 $28.00 $11.59 $7.49 4.6 14000 3.0 17.0 S21.00 1.723000 80 12.0$38.00 $15.98 $8.57 2.5 25000 9.4 15.5 $33.00 $15.87 $8.57 2.6 19000 4.0 11.0 $33.00 $13.62 $8.57 29% 27% 33% 23% 30% 0% 30% 0% 0% 0% 4.0 5.0 3.0 3.0 3.0 $7.81 $7.12 358 314 4/18/2012 6/30V2011 5/25/2011 AgapePmn
Step by Step Solution
There are 3 Steps involved in it

Get step-by-step solutions from verified subject matter experts