

Question: may I have help questions e through k please Show all your work and justify all of your answers and conclusions, except for the TRUE/FALSE
may I have help questions e through k please
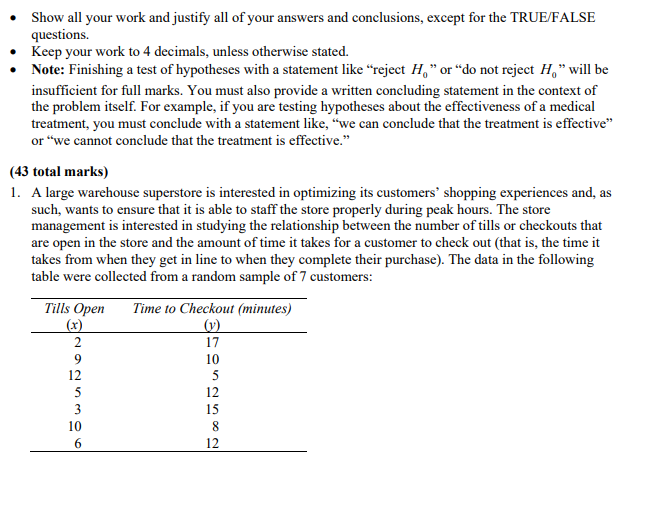
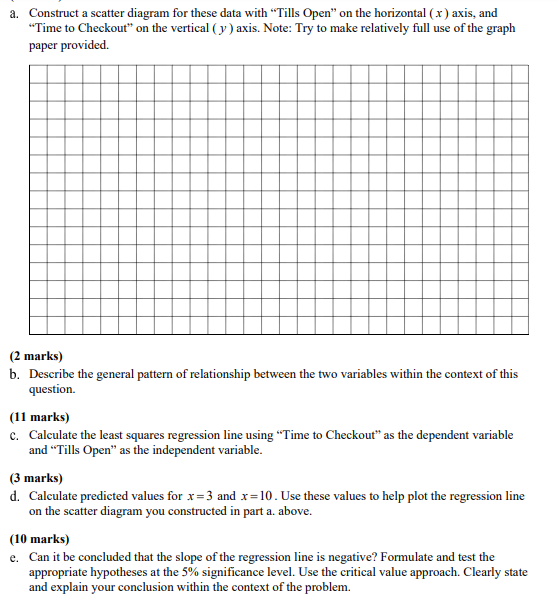
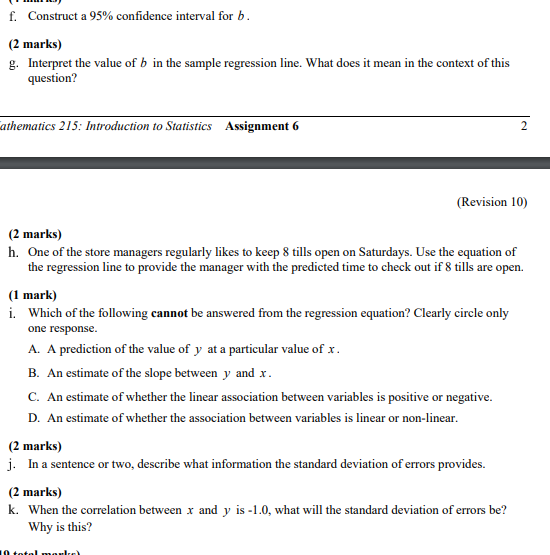
Show all your work and justify all of your answers and conclusions, except for the TRUE/FALSE questions. Keep your work to 4 decimals, unless otherwise stated. Note: Finishing a test of hypotheses with a statement like reject H," or "do not reject H," will be insufficient for full marks. You must also provide a written concluding statement in the context of the problem itself. For example, if you are testing hypotheses about the effectiveness of a medical treatment, you must conclude with a statement like, "we can conclude that the treatment is effective" or we cannot conclude that the treatment is effective." (43 total marks) 1. A large warehouse superstore is interested in optimizing its customers' shopping experiences and, as such, wants to ensure that it is able to staff the store properly during peak hours. The store management is interested in studying the relationship between the number of tills or checkouts that are open in the store and the amount of time it takes for a customer to check out that is, the time it takes from when they get in line to when they complete their purchase). The data in the following table were collected from a random sample of 7 customers: Time to Checkout (minutes) Tills Open (x) 2 9 12 5 3 10 6 17 10 5 12 15 8 12 a. Construct a scatter diagram for these data with Tills Open" on the horizontal ( x ) axis, and "Time to Checkout" on the vertical (y) axis. Note: Try to make relatively full use of the graph paper provided (2 marks) b. Describe the general pattern of relationship between the two variables within the context of this question. (11 marks) c. Calculate the least squares regression line using Time to Checkout" as the dependent variable and "Tills Open" as the independent variable. (3 marks) d. Calculate predicted values for x=3 and x=10. Use these values to help plot the regression line on the scatter diagram you constructed in part a. above. (10 marks) e. Can it be concluded that the slope of the regression line is negative? Formulate and test the appropriate hypotheses at the 5% significance level. Use the critical value approach. Clearly state and explain your conclusion within the context of the problem. f. Construct a 95% confidence interval for b. (2 marks) g. Interpret the value of b in the sample regression line. What does it mean in the context of this question? athematics 215: Introduction to Statistics Assignment 6 2 (Revision 10) (2 marks) h. One of the store managers regularly likes to keep 8 tills open on Saturdays. Use the equation of the regression line to provide the manager with the predicted time to check out if 8 tills are open. (1 mark) i. Which of the following cannot be answered from the regression equation? Clearly circle only one response. A. A prediction of the value of y at a particular value of x. B. An estimate of the slope between y and x. C. An estimate of whether the linear association between variables is positive or negative. D. An estimate of whether the association between variables is linear or non-linear. (2 marks) j. In a sentence or two, describe what information the standard deviation of errors provides. (2 marks) k. When the correlation between x and y is -1.0, what will the standard deviation of errors be? Why is thisStep by Step Solution
There are 3 Steps involved in it
1 Expert Approved Answer
Step: 1 Unlock

Question Has Been Solved by an Expert!
Get step-by-step solutions from verified subject matter experts
Step: 2 Unlock
Step: 3 Unlock