

Question: MC AC D E Demand FI 64. The figure above shows demand and short-run cost curves for a perfectly competitive firm. At its profit-maximizing level
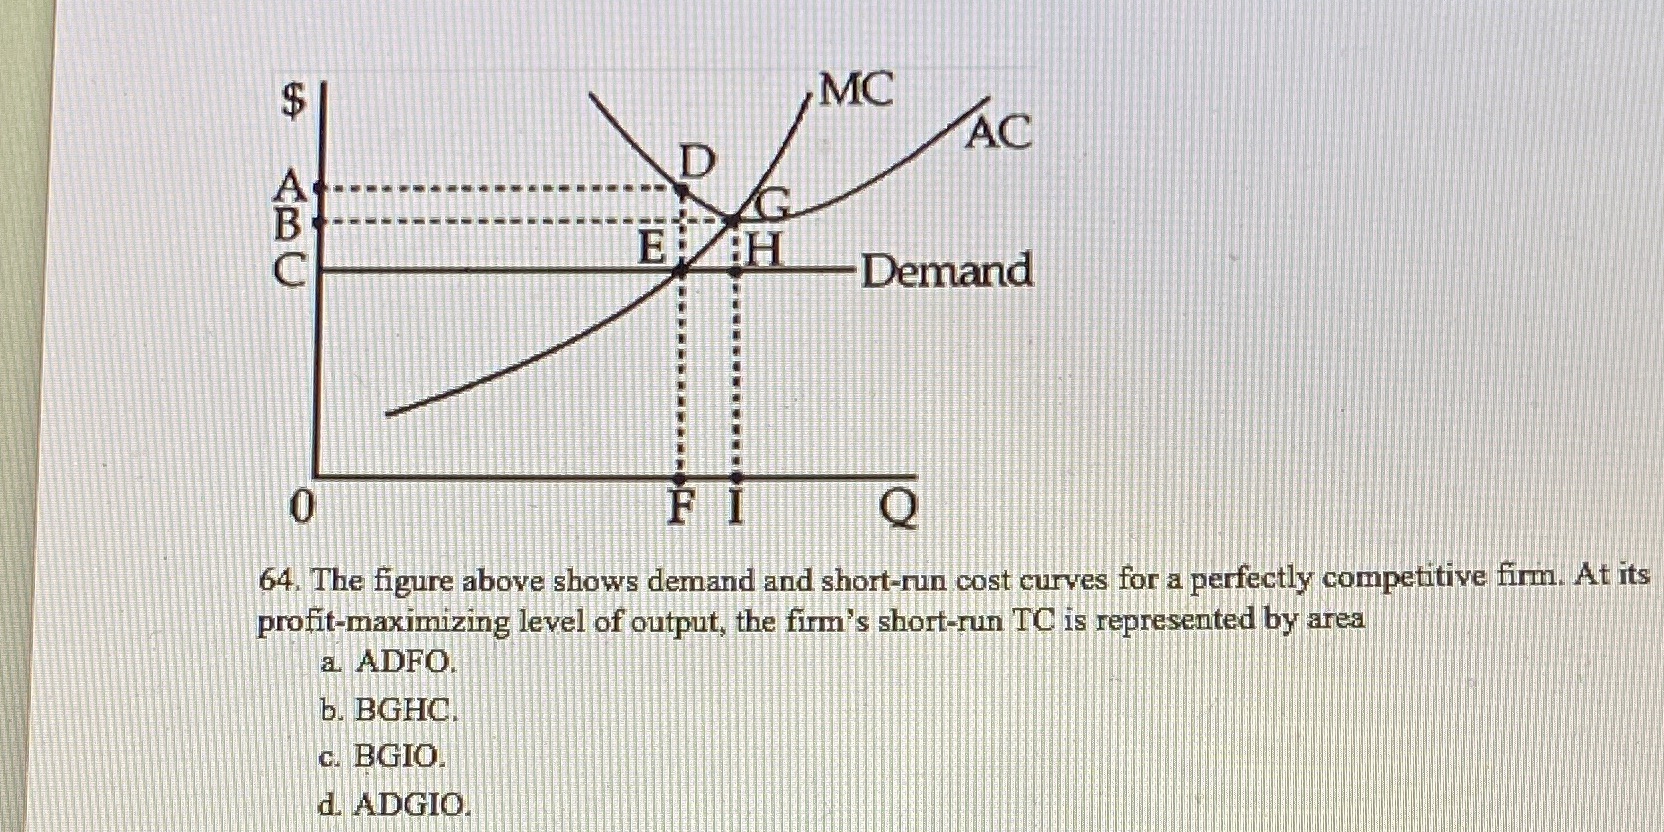

MC AC D E Demand FI 64. The figure above shows demand and short-run cost curves for a perfectly competitive firm. At its profit-maximizing level of output, the firm's short-run TO is represented by area a ADFO b. BGHO. C. BGIO d. ADGIO
Step by Step Solution
There are 3 Steps involved in it
1 Expert Approved Answer
Step: 1 Unlock

Question Has Been Solved by an Expert!
Get step-by-step solutions from verified subject matter experts
Step: 2 Unlock
Step: 3 Unlock