

Question: mc, has the i Data Table - X icon to vi irements 2018 2017 1. Comp he result Sales revenue $ 256,000 $ 250,000 December
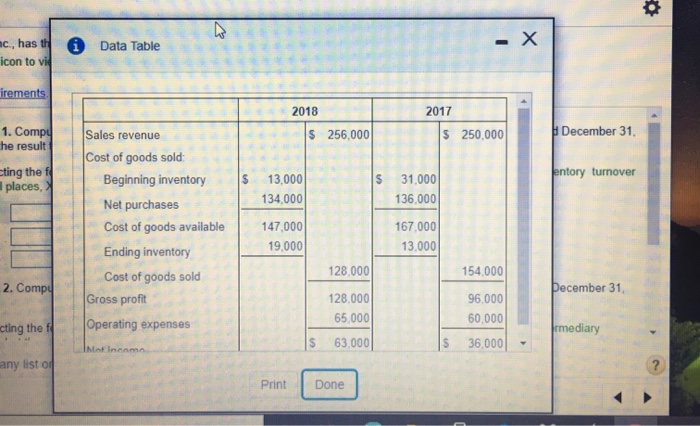
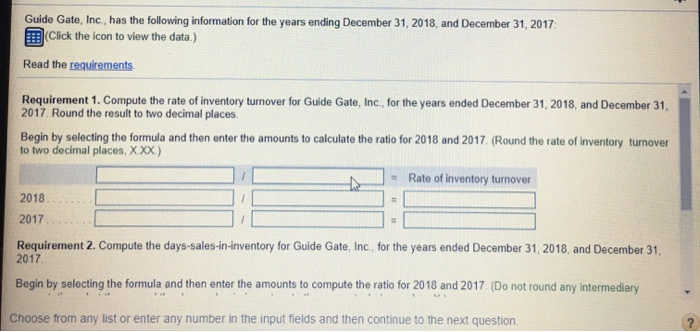
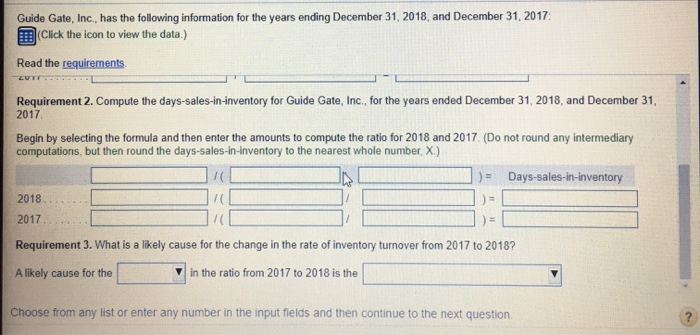
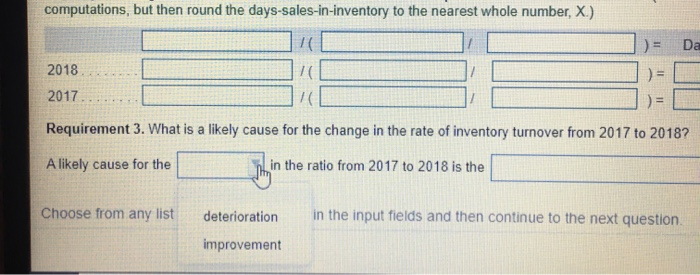
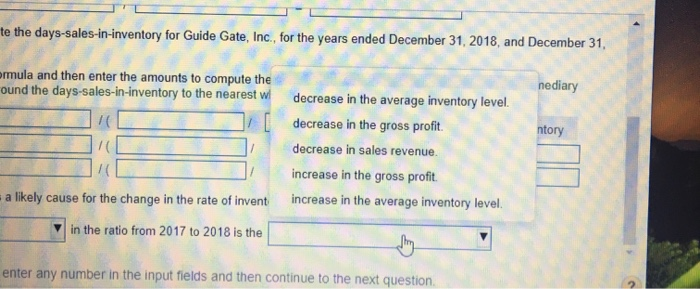
mc, has the i Data Table - X icon to vi irements 2018 2017 1. Comp he result Sales revenue $ 256,000 $ 250,000 December 31 cting the fil places, $ $ entory turnover 13,000 134,000 31,000 136.000 Cost of goods sold: Beginning inventory Net purchases Cost of goods available Ending inventory Cost of goods sold Gross profit Operating expenses 147.000 19,000 167,000 13,000 128,000 154.000 2. Comp ecember 31 128,000 65,000 96.000 60,000 cting the fl rmediary $ 63,000 36.000 I Motin.com any list of Print Done Guide Gate, Inc., has the following information for the years ending December 31, 2018, and December 31, 2017 Click the icon to view the data.) Read the requirements Requirement 1. Compute the rate of inventory turnover for Guide Gate, Inc., for the years ended December 31, 2018, and December 31, 2017 Round the result to two decimal places. Begin by selecting the formula and then enter the amounts to calculate the ratio for 2018 and 2017. (Round the rate of inventory turnover to two decimal places, X.XX.) Rate of inventory turnover 2018 2017 Requirement 2. Compute the days-sales-in-inventory for Guide Gate, Inc., for the years ended December 31, 2018, and December 31, 2017 Begin by selecting the formula and then enter the amounts to compute the ratio for 2018 and 2017. (Do not round any intermediary Choose from any list or enter any number in the input fields and then continue to the next question Guide Gate, Inc., has the following information for the years ending December 31, 2018, and December 31, 2017 (Click the icon to view the data.) Read the requirements ZUTI Requirement 2. Compute the days-sales-in-inventory for Guide Gate, Inc., for the years ended December 31, 2018, and December 31, 2017 Begin by selecting the formula and then enter the amounts to compute the ratio for 2018 and 2017. (Do not round any intermediary computations, but then round the days-sales-in-inventory to the nearest whole number. X.) ) = Days-sales-in-inventory 2018 2017 Requirement 3. What is a likely cause for the change in the rate of inventory turnover from 2017 to 2018? A likely cause for the in the ratio from 2017 to 2018 is the Choose from any list or enter any number in the input fields and then continue to the next question computations, but then round the days-sales-in-inventory to the nearest whole number, X.) ) = Da 1 10 2018 = = 2017 Requirement 3. What is a likely cause for the change in the rate of inventory turnover from 2017 to 2018? A likely cause for the Tothing in the ratio from 2017 to 2018 is the Choose from any list deterioration in the input fields and then continue to the next question improvement te the days-sales-in-inventory for Guide Gate, Inc., for the years ended December 31, 2018, and December 31, nediary ntory ormula and then enter the amounts to compute the ound the days-sales-in-inventory to the nearest wl decrease in the average inventory level [ decrease in the gross profit. decrease in sales revenue. increase in the gross profit. a likely cause for the change in the rate of invent increase in the average inventory level. in the ratio from 2017 to 2018 is the enter any number in the input fields and then continue to the next
Step by Step Solution
There are 3 Steps involved in it

Get step-by-step solutions from verified subject matter experts