

Question: MEASURES OF CENTRALITY AND VARIABILITY A sample data on the viscosity from a batch of chemical process is given in the table below: PROCESS A
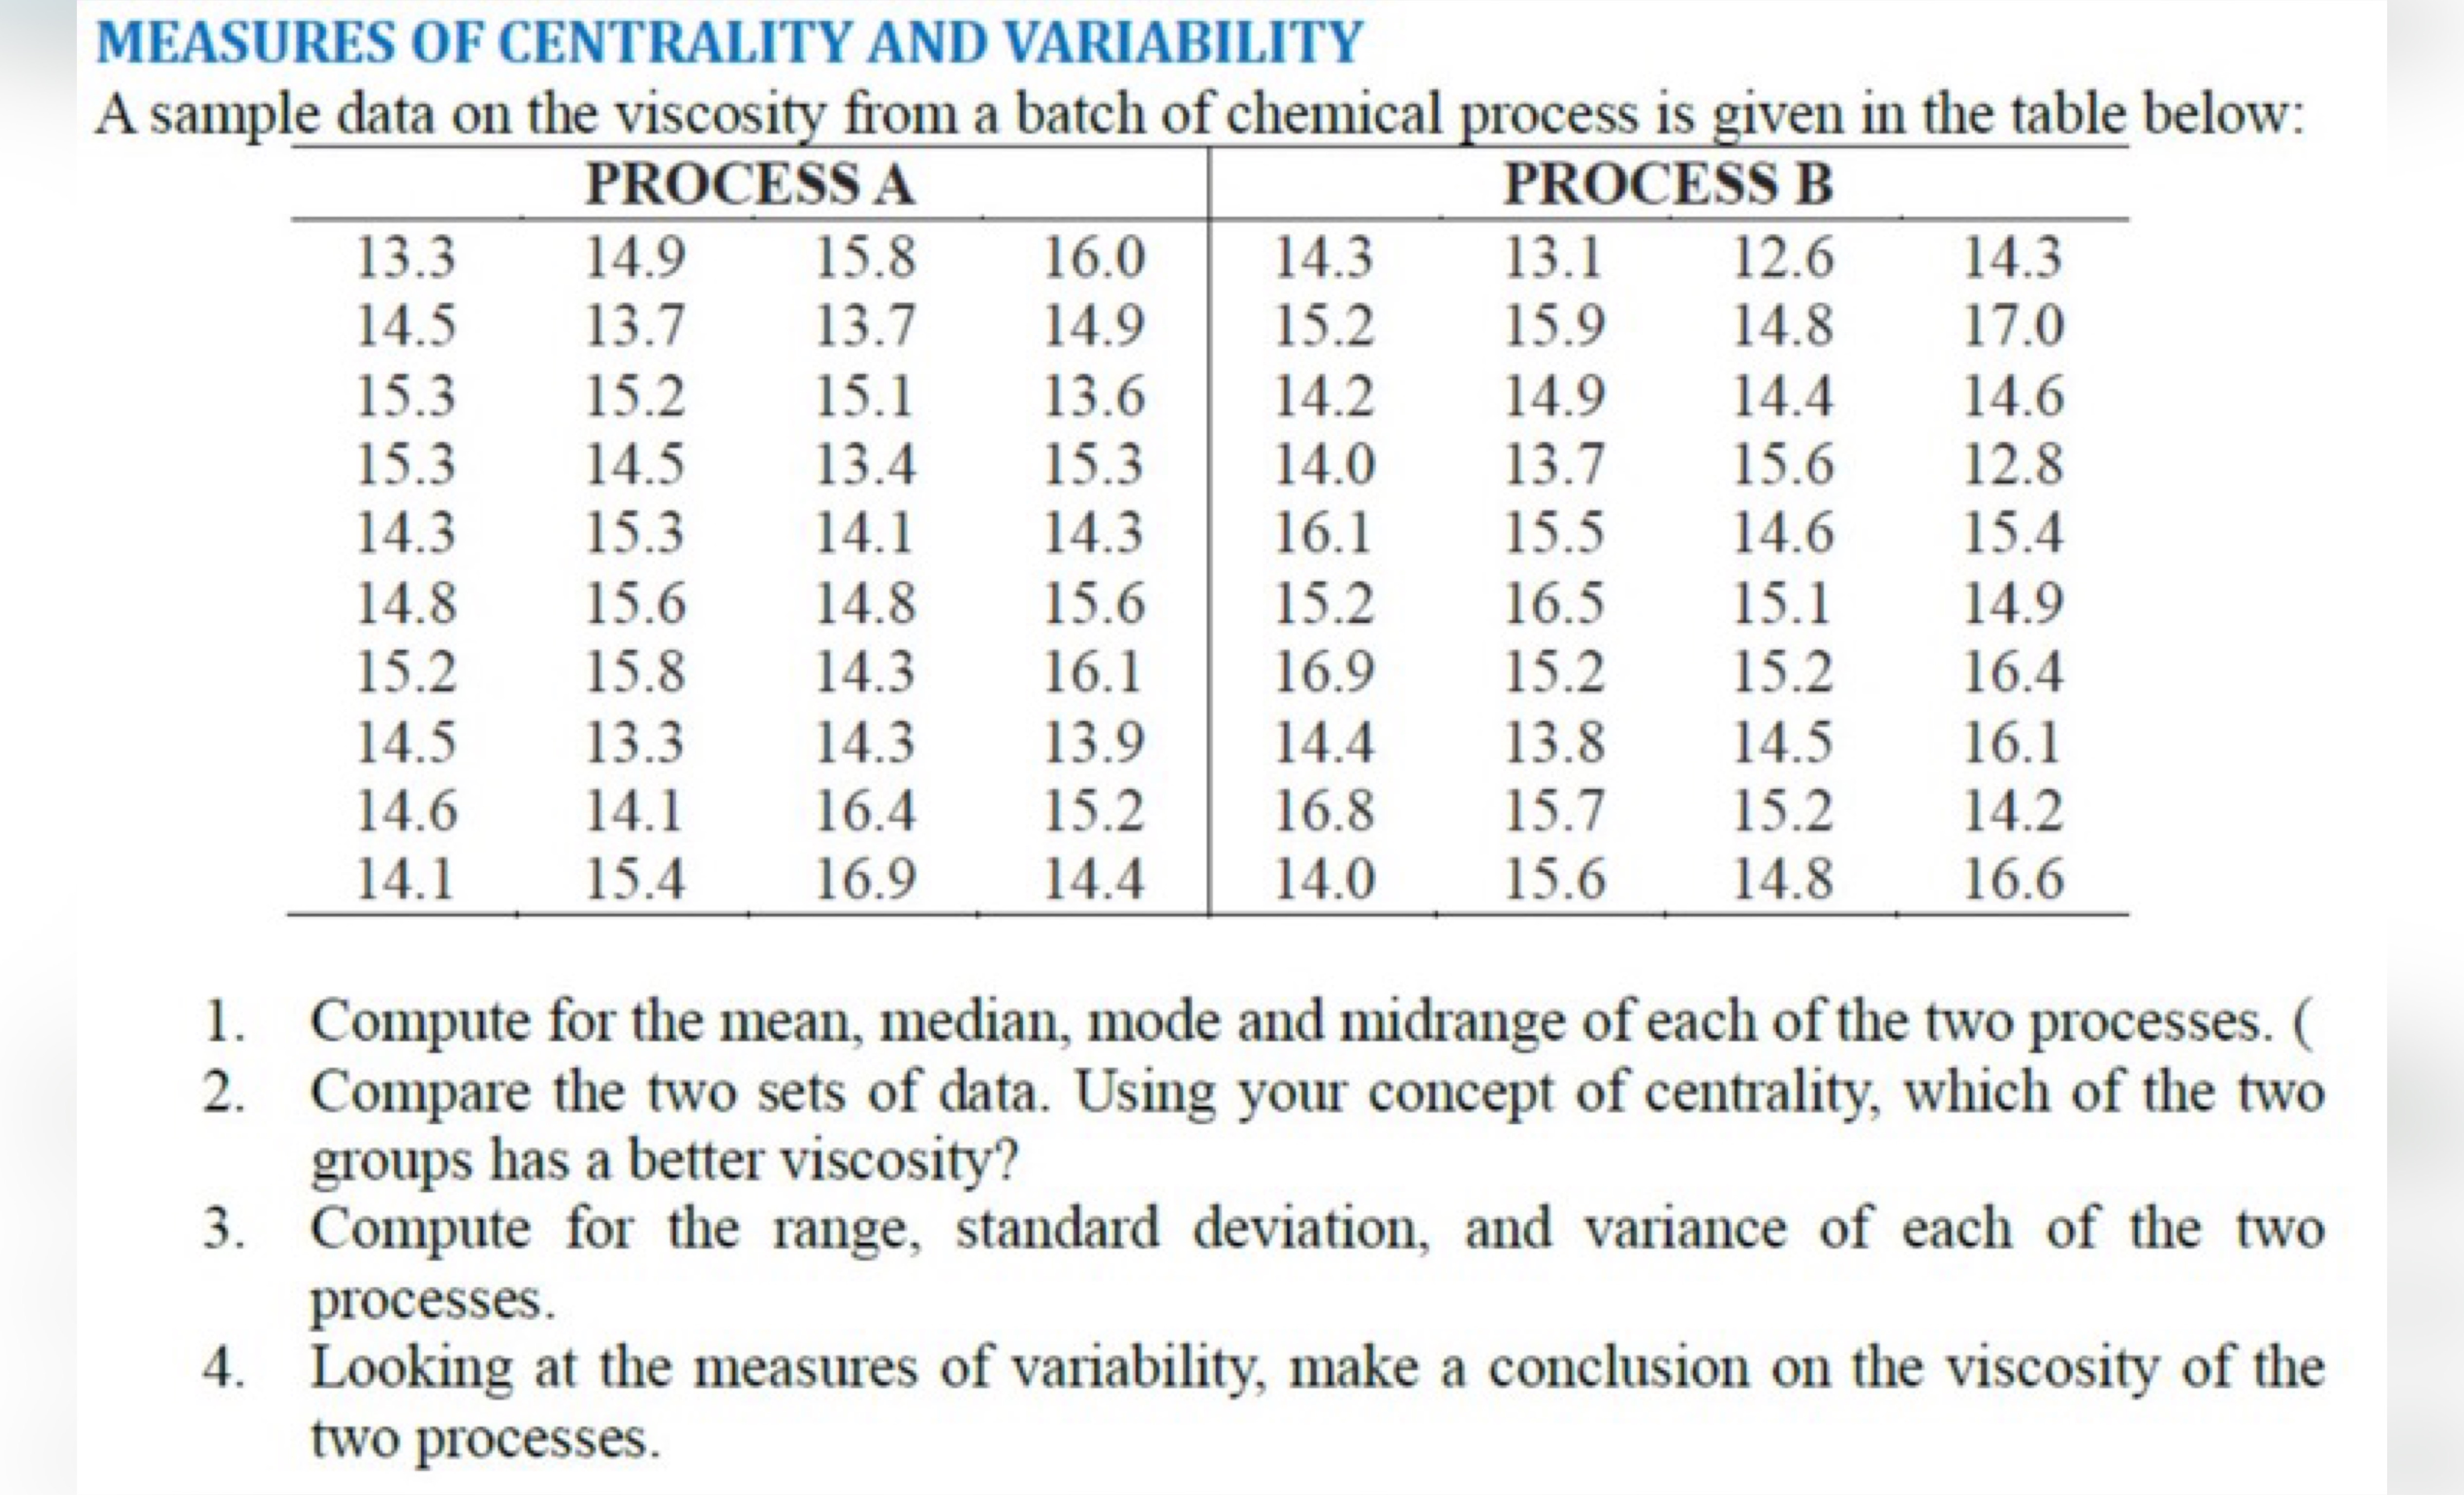
MEASURES OF CENTRALITY AND VARIABILITY A sample data on the viscosity from a batch of chemical process is given in the table below: PROCESS A PROCESS B 13.3 14.9 15.8 16.0 14.3 13.1 12.6 14.3 14.5 13.7 13.7 14.9 15.2 15.9 14.8 17.0 15.3 15.2 15.1 13.6 14.2 14.9 14.4 14.6 15.3 14.5 13.4 15.3 14.0 13.7 15.6 12.8 14.3 15.3 14.1 14.3 16.1 15.5 14.6 15.4 14.8 15.6 14.8 15.6 15.2 16.5 15.1 14.9 15.2 15.8 14.3 16.1 16.9 15.2 15.2 16.4 14.5 13.3 14.3 13.9 14.4 13.8 14.5 16.1 14.6 14.1 16.4 15.2 16.8 15.7 15.2 14.2 14.1 15.4 16.9 14.4 14.0 15.6 14.8 16.6 1. Compute for the mean, median, mode and midrange of each of the two processes. ( 2. Compare the two sets of data. Using your concept of centrality, which of the two groups has a better viscosity? 3. Compute for the range, standard deviation, and variance of each of the two processes. 4. Looking at the measures of variability, make a conclusion on the viscosity of the two processes
Step by Step Solution
There are 3 Steps involved in it

Get step-by-step solutions from verified subject matter experts