

Question: measuring avogadro number lab report with excell data 2. Rinse the strips with deionized water and then dry them with tissues or a paper towel.
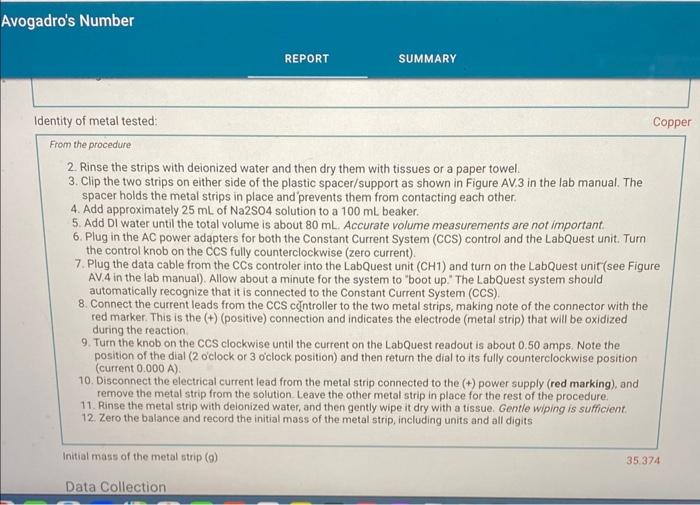
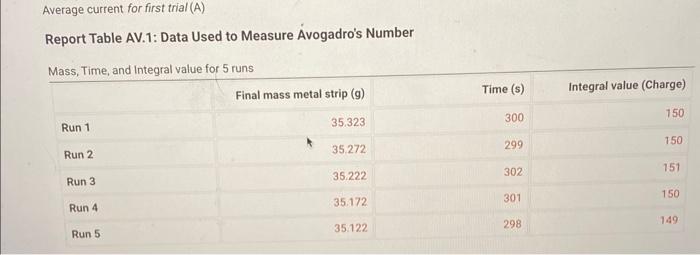
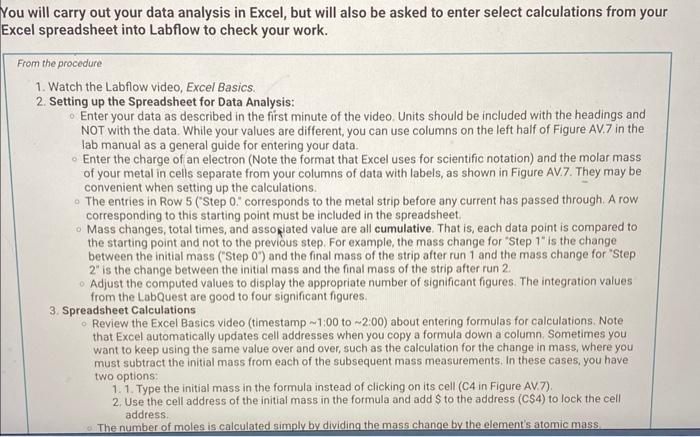
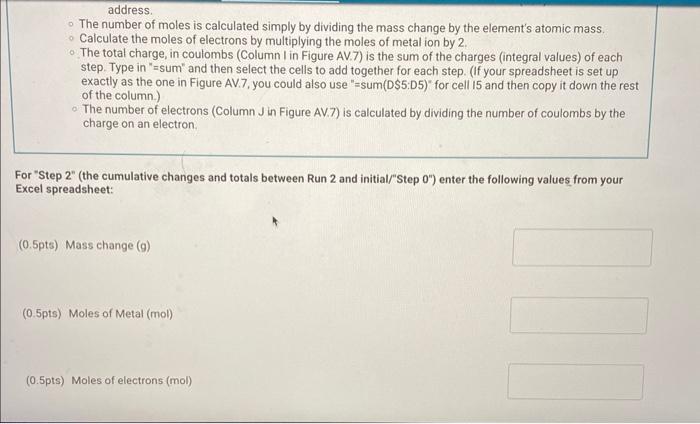
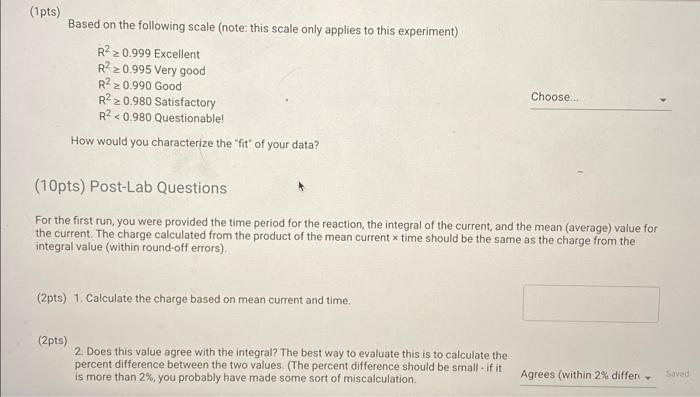
2. Rinse the strips with deionized water and then dry them with tissues or a paper towel. 3. Clip the two strips on either side of the plastic spacer/support as shown in Figure AV.3 in the lab manual. The spacer holds the metal strips in place and prevents them from contacting each other. 4. Add approximately 25mL of Na2SO4 solution to a 100mL beaker. 5. Add DI water until the total volume is about 80mL. Accurate volume measurements are not important. 6. Plug in the AC power adapters for both the Constant Current System (CCS) control and the LabQuest unit. Turn the control knob on the CCS fully counterclockwise (zero current). 7. Plug the data cable from the CCs controler into the LabQuest unit ( CH1) and turn on the LabQuest unit (see Figure AV.4 in the lab manual). Allow about a minute for the system to "boot up." The LabQuest system should automatically recognize that it is connected to the Constant Current System (CCS). 8. Connect the current leads from the CCS cclintroller to the two metal strips, making note of the connector with the red marker. This is the (+) (positive) connection and indicates the electrode (metal strip) that will be oxidized during the reaction. 9. Turn the knob on the CCS clockwise until the current on the LabQuest readout is about 0.50 amps. Note the position of the dial ( 2 lock or 3 o'clock position) and then return the dial to its fully counterclockwise position (current 0.000A ). 10. Disconnect the electrical current lead from the metal strip connected to the (t) power supply (red marking), and remove the metal strip from the solution. Leave the other metal strip in place for the rest of the procedure. 11. Rinse the metal strip with deionized water, and then gently wipe it dry with a tissue. Gentle wiping is sufficient. 12. Zero the balance and record the initial mass of the metal strip, including units and all digits Report Table AV.1: Data Used to Measure Avogadro's Number 'ou will carry out your data analysis in Excel, but will also be asked to enter select calculations from your xcel spreadsheet into Labflow to check your work. From the procedure 1. Watch the Labflow video, Excel Basics. 2. Setting up the Spreadsheet for Data Analysis: Enter your data as described in the first minute of the video. Units should be included with the headings and NOT with the data. While your values are different, you can use columns on the left half of Figure AV.7 in the lab manual as a general guide for entering your data. Enter the charge of an electron (Note the format that Excel uses for scientific notation) and the molar mass of your metal in cells separate from your columns of data with labels, as shown in Figure AV.7. They may be convenient when setting up the calculations. The entries in Row 5 ("Step 0." corresponds to the metal strip before any current has passed through. A row corresponding to this starting point must be included in the spreadsheet. - Mass changes, total times, and associated value are all cumulative. That is, each data point is compared to the starting point and not to the previous step. For example, the mass change for "Step 1 " is the change between the initial mass ("Step 0") and the final mass of the strip after run 1 and the mass change for "Step 2 ' is the change between the initial mass and the final mass of the strip after run 2. Adjust the computed values to display the appropriate number of significant figures. The integration values from the LabQuest are good to four significant figures. 3. Spreadsheet Calculations Review the Excel Basics video (timestamp 1:00 to 2:00 ) about entering formulas for calculations. Note that Excel automatically updates cell addresses when you copy a formula down a column. Sometimes you want to keep using the same value over and over, such as the calculation for the change in mass, where you must subtract the initial mass from each of the subsequent mass measurements. In these cases, you have two options: 1. 1. Type the initial mass in the formula instead of clicking on its cell (C4 in Figure AV.7). 2. Use the cell address of the initial mass in the formula and add $ to the address (C\$4) to lock the cell address. The number of moles is calculated simply by dividing the mass change by the element's atomic mass. address. The number of moles is calculated simply by dividing the mass change by the element's atomic mass. Calculate the moles of electrons by multiplying the moles of metal ion by 2 . - The total charge, in coulombs (Column I in Figure AV.7) is the sum of the charges (integral values) of each step. Type in "=sum" and then select the cells to add together for each step. (If your spreadsheet is set up exactly as the one in Figure AV.7, you could also use "=sum(DS5:D5)" for cell I5 and then copy it down the rest of the column.) - The number of electrons (Column J in Figure AV.7) is calculated by dividing the number of coulombs by the charge on an electron. For "Step 2 " (the cumulative changes and totals between Run 2 and initial/"Step 0") enter the following values from your Excel spreadsheet: (0.5pts) Mass change (g) (0.5pts) Moles of Metal (mol) (0.5pts) Moles of electrons (mol) (0.5pts) Mores of electrons (mol) (0.5pts) Total charge (coulombs) (0.5pts) Number of electrons From the procedure 4. Plotting your Data: Review the Excel Basics video starting at timestamp 3:43 through to the end. Follow the example from the video to insert a scatter plot. The x-axis should be moles of electrons and the y-axis should be number of electrons. 5. Make sure the correct data are plotted along each axis. The data should fall approximately along a line. The y-axis data should be very large and the x-axis data should be small. Do NOT include a 0,0 point in your plot. 6. Label your graph - Include your name and any partners' names in the title, along with a description of the plot itself. - The plot title and axis labels should be descriptive and not just "x-values," etc. 7. Add a trendline and include the equation and R-squared value on the plot. The slope is the number of electrons/mole of electrons, or NA, with units of mol1 (per mole). Export an image of your trendline plot and upload the image here. Upload as an image file (.png or.jpg) Browse your files or Diag and D (0.5pts) Enter the slope of your trendline (0.5pts) Enter the y-intercept of your trendline (0.5pts) Enter the y-intercept of your trendline (0.5pts) Enter the R2 of your trendline (1pts) What is your experimental value for Avogadro's number? From the procedure 8. Calculate the percent error for your experimental value of Avogadro's number. Use a theoretical value of 6.0221023 (2pts) What is the percent error in your experimental value? From the procedure 9. Make a copy of your spreadsheet. As part of the data analysis, you will be asked to consider the effect of some potential systematic errors on your calculated value for Avogadro's number. You can evaluate the effects of hypothetical errors in your data in the copied spreadsheet by altering a set of measurements and observing the effect on the plot and on the trendine equation. 10. Print/Save two one-page versions of the spreadsheet per student, the normal spreadsheet and the version showing formulas (use CTRL + ) . (15pts) Upload your spreadsheet. UPLOAD THE xIsx FILE here. (1pts) Based on the following scale (note: this scale only applies to this experiment) R20.999ExcellentR20.995VerygoodR20.990GoodR20.980SatisfactoryR2
Step by Step Solution
There are 3 Steps involved in it

Get step-by-step solutions from verified subject matter experts