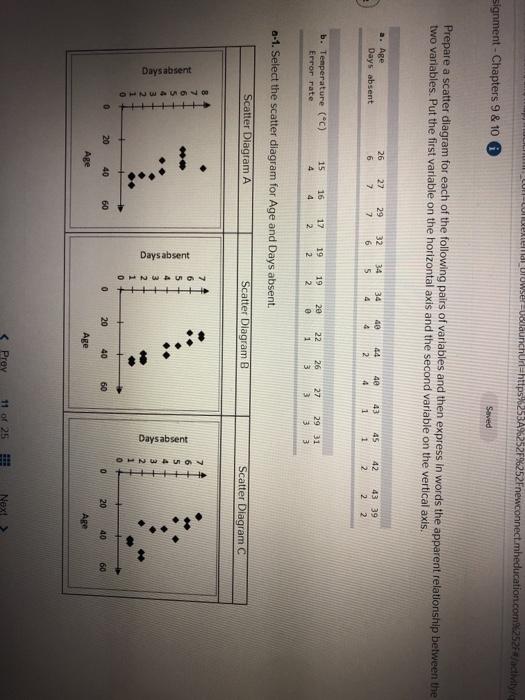
Question: Med Urowser-Vodaunchurl=https%253A%25 F%252Fnewconnect.mheducation.com%252F/activity signment - Chapters 9 & 10 Saved Prepare a scatter diagram for each of the following pairs of variables and then express

Med Urowser-Vodaunchurl=https%253A%25
Med Urowser-Vodaunchurl=https%253A%25 F%252Fnewconnect.mheducation.com%252F/activity signment - Chapters 9 & 10 Saved Prepare a scatter diagram for each of the following pairs of variables and then express in words the apparent relationship between the two variables. Put the first variable on the horizontal axis and the second variable on the vertical axis. a. Age Days absent 26 6 27 7 29 7 32 6 44 40 34 5 45 34 4 40 4 43 1 42 2 4 1 43 39 2 2 b. Temperature (C) Error rate 15 4 16 4 17 2 19 2 2e 19 2 27 26 22 1 w 29 31 3 3 3 -1. Select the scatter diagram for Age and Days absent. Scatter Diagram A Scatter Diagram B Scatter Diagram C Days absent wo 00 +++ 0 20 40 60 0 20 40 60 20 40 60 Age Age Are Prey 11 of 25 Next

Step by Step Solution

There are 3 Steps involved in it

1 Expert Approved Answer
Step: 1 Unlock blur-text-image
Question Has Been Solved by an Expert!

Get step-by-step solutions from verified subject matter experts

Step: 2 Unlock
Step: 3 Unlock

Students Have Also Explored These Related General Management Questions!