

Question: Meg plotted the graph below to show the relationship between the temperature of her city and the number of people at a swimming pool: Swimming

Meg plotted the graph below to show the relationship between the temperature of her city and the number of people at a swimming pool:
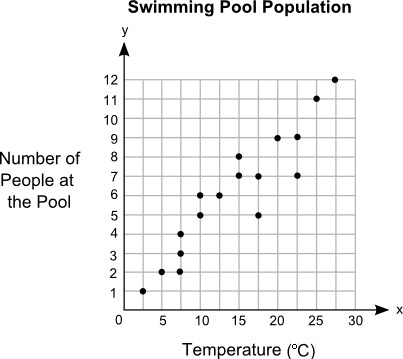
Swimming Pool Population 12 11 10 Number of People at the Pool UNWAGONOOC O 5 10 15 20 25 30 Temperature (C)
Step by Step Solution
There are 3 Steps involved in it
1 Expert Approved Answer
Step: 1 Unlock

Question Has Been Solved by an Expert!
Get step-by-step solutions from verified subject matter experts
Step: 2 Unlock
Step: 3 Unlock