

Question: Menu Pricing and Control 229 B C D E F ot a G H I J mat % of sales Item selling price $ Number
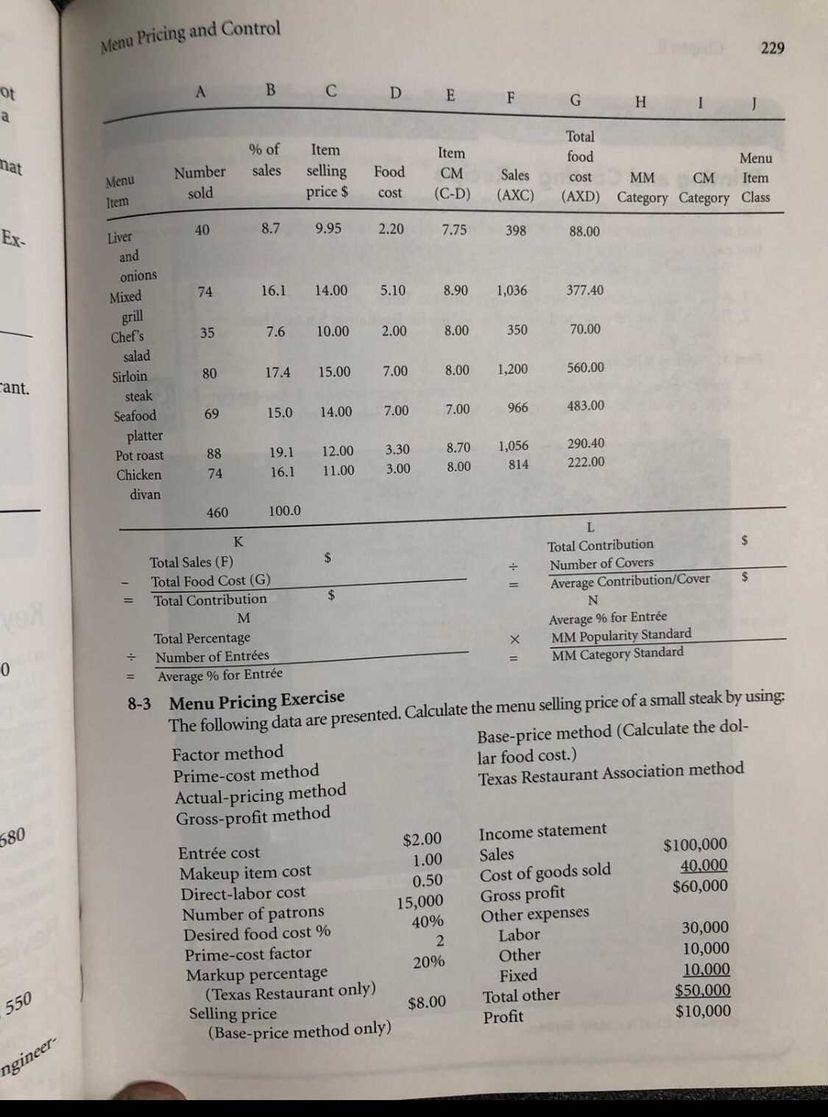
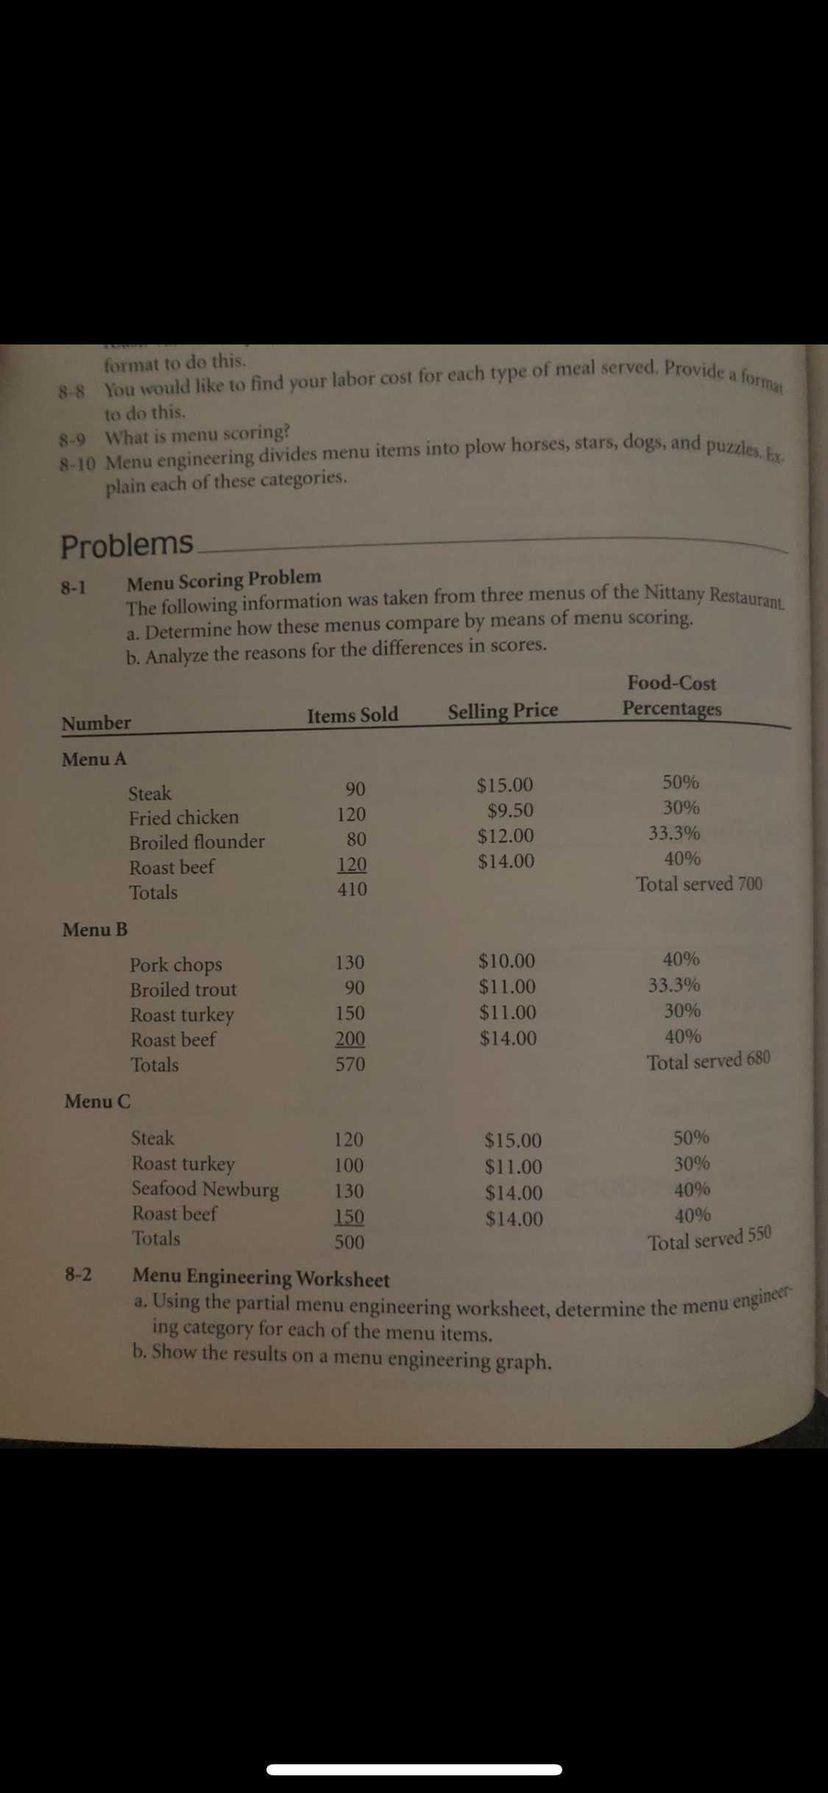
Menu Pricing and Control 229 B C D E F ot a G H I J mat % of sales Item selling price $ Number sold Item (C-D) Food cost Menu Item Total food Menu cost MM CM Item (AXD) Category Category Class Sales (AXC) 40 8.7 9.95 2.20 7.75 398 88.00 Ex- 74 16.1 14.00 5.10 8.90 1,036 377.40 Liver and onions Mixed grill Chef's salad 35 7.6 10.00 2.00 8.00 350 70.00 80 17.4 15.00 7.00 8.00 1,200 560.00 ant. 69 15.0 14.00 7.00 7.00 966 483.00 Sirloin steak Seafood platter Pot roast Chicken divan 88 74 19.1 16.1 12.00 11.00 3.30 3.00 8.70 8.00 1,056 814 290.40 222.00 460 100.0 $ - 0 K L Total Sales (F) Total Contribution Total Food Cost (G) Number of Covers Total Contribution Average Contribution/Cover M N Total Percentage Average % for Entre Number of Entres MM Popularity Standard Average % for Entre MM Category Standard 8-3 Menu Pricing Exercise The following data are presented. Calculate the menu selling price of a small steak by using Factor method Base-price method (Calculate the dol- Prime-cost method lar food cost.) Texas Restaurant Association method Actual-pricing method Gross-profit method $2.00 Income statement Entre cost Sales $100,000 Makeup item cost 0.50 Direct-labor cost 40.000 Cost of goods sold Number of patrons 15,000 Gross profit $60,000 Desired food cost % 40% Other expenses 2 Labor Prime-cost factor 30,000 2096 Other 10,000 Markup percentage Fixed (Texas Restaurant only) 10,000 Selling price $8.00 Total other $50,000 (Base-price method only) Profit $10,000 580 1.00 550 ngineer format to do this. 8-8. You would like to find your labor cost for each type of meal served. Provide a format to do this, 8-9 What is menu scoring? 8-10 Menu engineering divides menu items into plow horses, stars, dogs, and puzzles. Ex plain each of these categories. Problems 8-1 Menu Scoring Problem The following information was taken from three menus of the Nittany Restaurant a. Determine how these menus compare by means of menu scoring. b. Analyze the reasons for the differences in scores. Food-Cost Percentages Number Items Sold Selling Price Menu A Steak Fried chicken Broiled flounder Roast beef Totals 90 120 80 120 410 $15.00 $9.50 $12.00 $14.00 50% 30% 33.3% 40% Total served 700 Menu B Pork chops Broiled trout Roast turkey Roast beef Totals 130 90 150 200 570 $10.00 $11.00 $11.00 $14.00 40% 33.3% 30% 40% Total served 680 Menu C Steak Roast turkey Seafood Newburg Roast beef Totals 120 100 130 150 500 $15.00 $11.00 $14.00 $14.00 50% 30% 40% 40% Total served 550 8-2 Menu Engineering Worksheet a. Using the partial menu engineering worksheet, determine the menu engineer ing category for each of the menu items. b. Show the results on a menu engineering graph. Menu Pricing and Control 229 B C D E F ot a G H I J mat % of sales Item selling price $ Number sold Item (C-D) Food cost Menu Item Total food Menu cost MM CM Item (AXD) Category Category Class Sales (AXC) 40 8.7 9.95 2.20 7.75 398 88.00 Ex- 74 16.1 14.00 5.10 8.90 1,036 377.40 Liver and onions Mixed grill Chef's salad 35 7.6 10.00 2.00 8.00 350 70.00 80 17.4 15.00 7.00 8.00 1,200 560.00 ant. 69 15.0 14.00 7.00 7.00 966 483.00 Sirloin steak Seafood platter Pot roast Chicken divan 88 74 19.1 16.1 12.00 11.00 3.30 3.00 8.70 8.00 1,056 814 290.40 222.00 460 100.0 $ - 0 K L Total Sales (F) Total Contribution Total Food Cost (G) Number of Covers Total Contribution Average Contribution/Cover M N Total Percentage Average % for Entre Number of Entres MM Popularity Standard Average % for Entre MM Category Standard 8-3 Menu Pricing Exercise The following data are presented. Calculate the menu selling price of a small steak by using Factor method Base-price method (Calculate the dol- Prime-cost method lar food cost.) Texas Restaurant Association method Actual-pricing method Gross-profit method $2.00 Income statement Entre cost Sales $100,000 Makeup item cost 0.50 Direct-labor cost 40.000 Cost of goods sold Number of patrons 15,000 Gross profit $60,000 Desired food cost % 40% Other expenses 2 Labor Prime-cost factor 30,000 2096 Other 10,000 Markup percentage Fixed (Texas Restaurant only) 10,000 Selling price $8.00 Total other $50,000 (Base-price method only) Profit $10,000 580 1.00 550 ngineer format to do this. 8-8. You would like to find your labor cost for each type of meal served. Provide a format to do this, 8-9 What is menu scoring? 8-10 Menu engineering divides menu items into plow horses, stars, dogs, and puzzles. Ex plain each of these categories. Problems 8-1 Menu Scoring Problem The following information was taken from three menus of the Nittany Restaurant a. Determine how these menus compare by means of menu scoring. b. Analyze the reasons for the differences in scores. Food-Cost Percentages Number Items Sold Selling Price Menu A Steak Fried chicken Broiled flounder Roast beef Totals 90 120 80 120 410 $15.00 $9.50 $12.00 $14.00 50% 30% 33.3% 40% Total served 700 Menu B Pork chops Broiled trout Roast turkey Roast beef Totals 130 90 150 200 570 $10.00 $11.00 $11.00 $14.00 40% 33.3% 30% 40% Total served 680 Menu C Steak Roast turkey Seafood Newburg Roast beef Totals 120 100 130 150 500 $15.00 $11.00 $14.00 $14.00 50% 30% 40% 40% Total served 550 8-2 Menu Engineering Worksheet a. Using the partial menu engineering worksheet, determine the menu engineer ing category for each of the menu items. b. Show the results on a menu engineering graph
Step by Step Solution
There are 3 Steps involved in it

Get step-by-step solutions from verified subject matter experts