

Question: Merchandising QUESTION 2 Complete the attached Corporate Analyzer by copy (ctri C ) and paste (ctri v) the chart into the answer box then fill

Merchandising


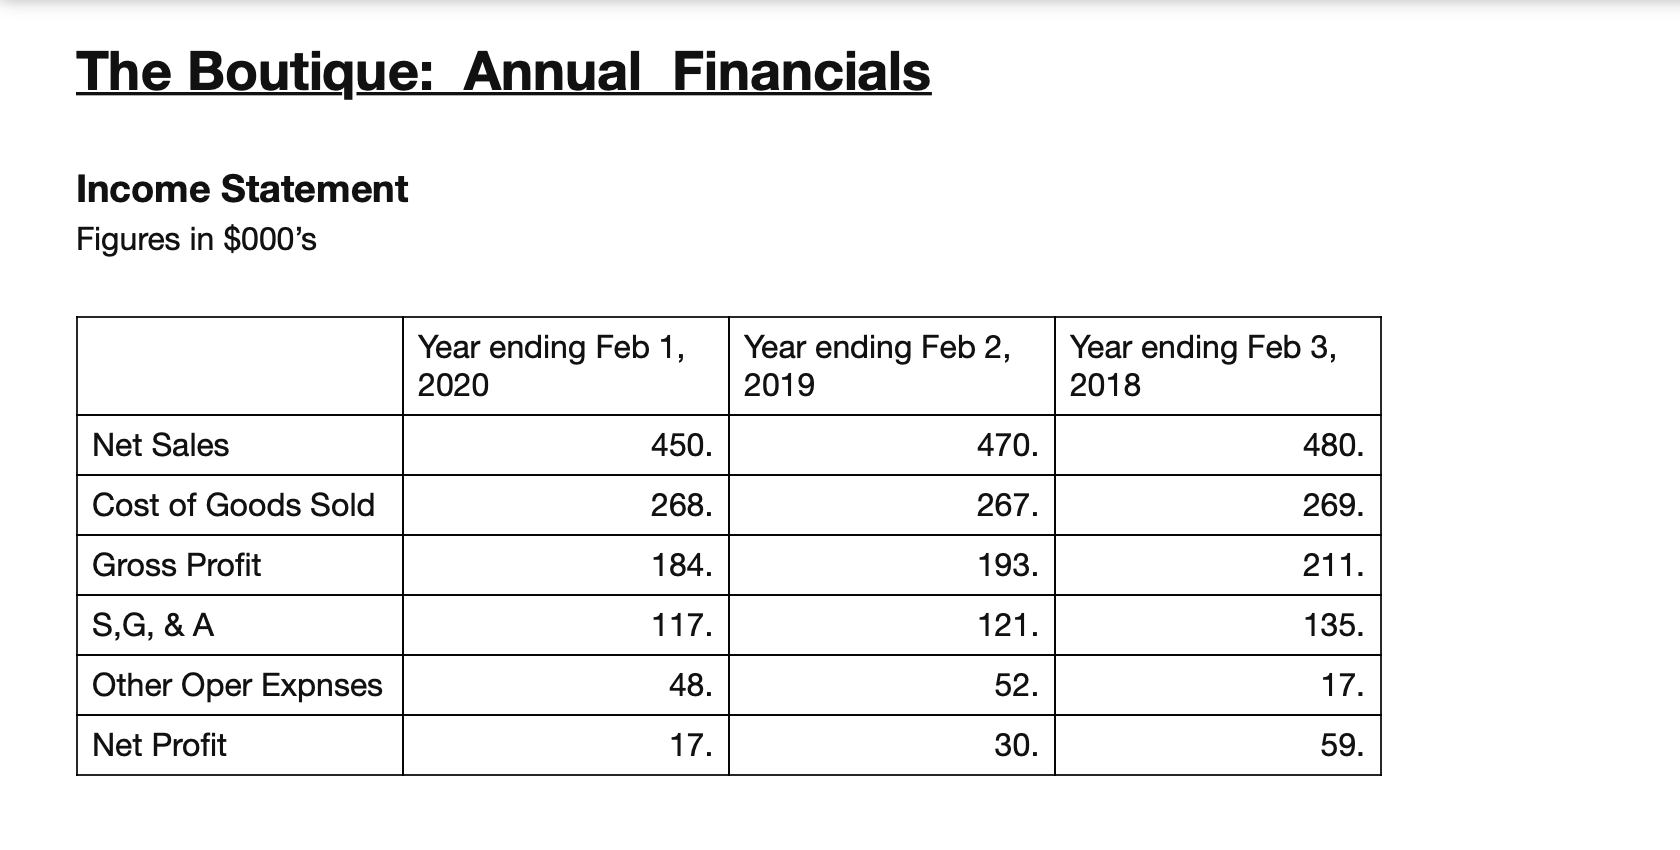
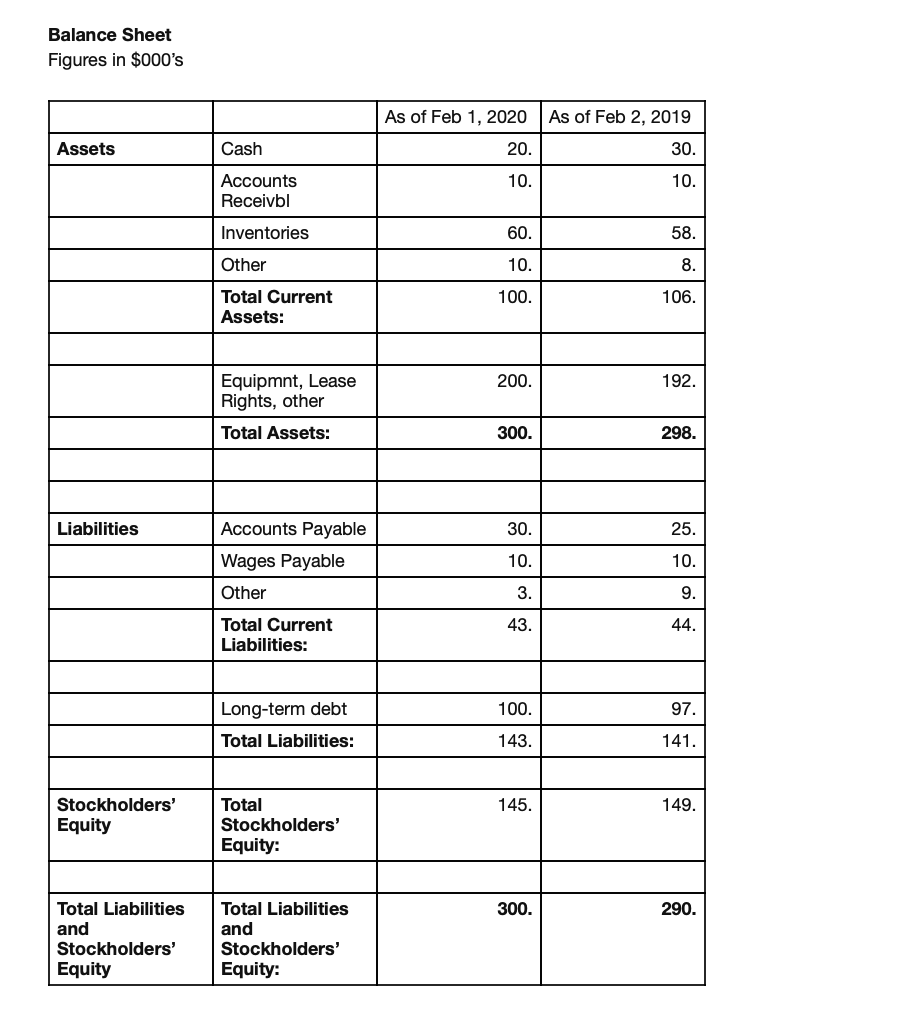
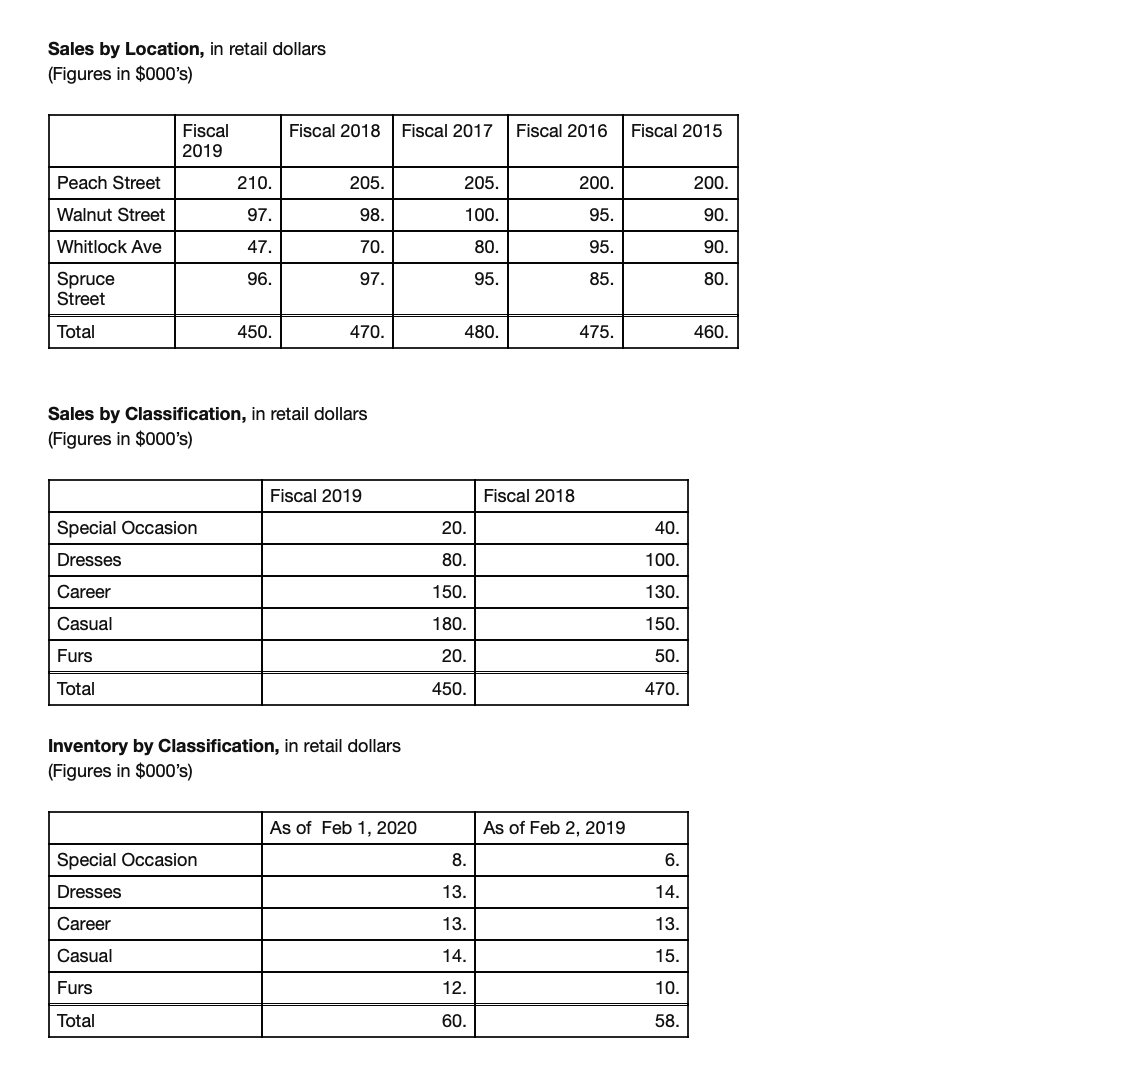
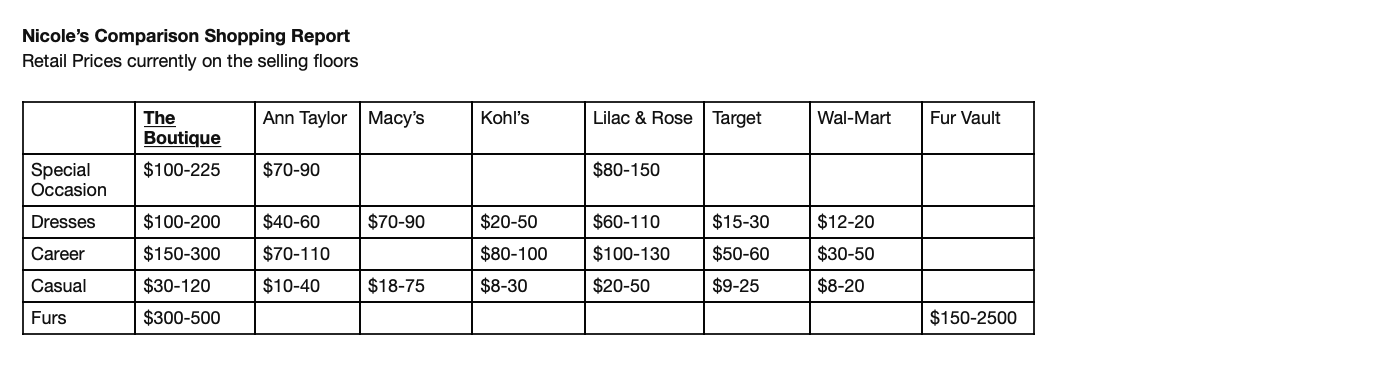
QUESTION 2 Complete the attached Corporate Analyzer by copy (ctri C ) and paste (ctri v) the chart into the answer box then fill in Financial Company's Benchmark: Measure (see Performance; Company's Past Benchmark: attachment) Period: 2019 Performance, specialty store Period:2018 Annual Sales 2.6% Increase (Decr.)% Gross Margin % 34.5% Operating 28.2% Expense (S,G, & A) % Net Profit Margin 5.4% % Inventory Turns 6.90 Current Ratio 1.20 Quick Ratio .75 Total Debt to .78 Equity RatioThe Boutique: Annual Financials Income Statement Figures in $000's Year ending Feb 1, Year ending Feb 2, Year ending Feb 3, 2020 2019 2018 Net Sales 450. 470. 480. Cost of Goods Sold 268. 267. 269. Gross Profit 184. 193. 211. S,G, & A 117. 121. 135. Other Oper Exposes 48. 52. 17. Net Profit 17. 30. 59.Balance Sheet Figures in $000's As of Feb 1, 2020 As of Feb 2, 2019 Assets Cash 20. 30 Accounts 10. 10. Receivbl Inventories 60. 58 Other 10 8. Total Current 100 106 Assets Equipmnt, Lease 200. 192. Rights, other Total Assets: 300 298 Liabilities Accounts Payable 30. 25. Wages Payable 10 10. Other 3 9. Total Current 43. 44. Liabilities: Long-term debt 100 97. Total Liabilities: 143. 141. Stockholders' Total 145. 149 Equity Stockholders' Equity: Total Liabilities Total Liabilities 300. 290. and and Stockholders' Stockholders' Equity Equity:Sales by Location, in retail dollars (Figures in $000's) Fiscal Fiscal 2018 Fiscal 2017 Fiscal 2016 Fiscal 2015 2019 Peach Street 210. 205 205. 200 200 Walnut Street 97. 98. 100. 95. 90. Whitlock Ave 47. 70. 80. 95. 90. Spruce 96 97. 95 85 80. Street Total 450. 470. 480 475 460. Sales by Classification, in retail dollars Figures in $000's) Fiscal 2019 Fiscal 2018 Special Occasion 20. 40. Dresses 80. 100. Career 150 130. Casual 180. 150. Furs 20. 50. Total 450. 470. Inventory by Classification, in retail dollars (Figures in $000's) As of Feb 1, 2020 As of Feb 2, 2019 Special Occasion 8. 6. Dresses 13. 14. Career 13. 13. Casua 14. 15. Furs 12. 10. Total 60. 58.Nicole's Comparison Shopping Report Retail Prices currently on the selling floors The Ann Taylor Macy's Kohl's Lilac & Rose Target Wal-Mart Fur Vault Boutique Special $100-225 $70-90 $80-150 Occasion Dresses $100-200 $40-60 $70-90 $20-50 $60-110 $15-30 $12-20 Career $150-300 $70-110 $80-100 $100-130 $50-60 $30-50 Casual $30-120 $10-40 $18-75 $8-30 $20-50 $9-25 $8-20 Furs $300-500 $150-2500
Step by Step Solution
There are 3 Steps involved in it

Get step-by-step solutions from verified subject matter experts