

Question: meter and the multimeter. 5 Create a graph by plotting the Overall Resistance on the y-axis and the Concentration of the FD&C red #40 dye
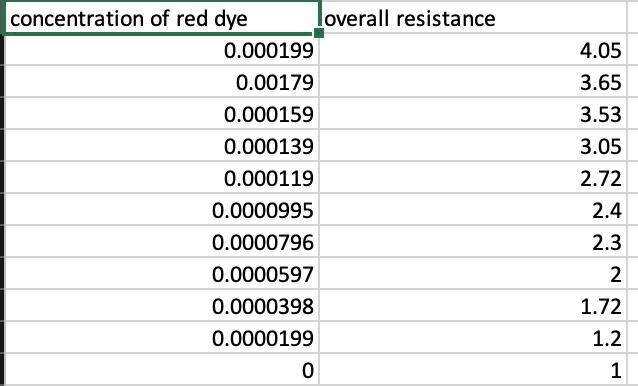
meter and the multimeter. 5 Create a graph by plotting the Overall Resistance on the y-axis and the Concentration of the FD&C red #40 dye on the x-axis. Add the equation for the line of best fit (y=mx+b) to the graph. Upload an image of the graph into Graph 1. concentration of red dye 0.000199 0.00179 0.000159 0.000139 0.000119 0.0000995 0.0000796 0.0000597 0.0000398 0.0000199 0 loverall resistance 4.05 3.65 3.53 3.05 2.72 2.4 2.3 2 1.72 1.2 1
Step by Step Solution
There are 3 Steps involved in it
1 Expert Approved Answer
Step: 1 Unlock

Question Has Been Solved by an Expert!
Get step-by-step solutions from verified subject matter experts
Step: 2 Unlock
Step: 3 Unlock