

Question: 21 Create a graph by plotting % Transmittance on the y-axis and the Concentration (M) of the FD&C red #40 dye on the x-axis. Add
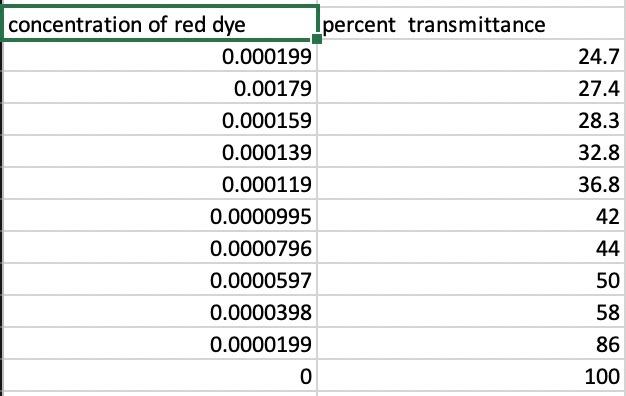
21 Create a graph by plotting % Transmittance on the y-axis and the Concentration (M) of the FD&C red #40 dye on the x-axis. Add the equation for the line of best fitymx +b) to the graph Upload an image of the graphinto Graph 2 Note: The best fit line is exponential for % Transmittance vs Concentration concentration of red dye Ipercent transmittance 0.000199 0.00179 0.000159 0.000139 0.000119 0.0000995 0.0000796 0.0000597 0.0000398 0.0000199 0 24.7 27.4 28.3 32.8 36.8 42 44 50 58 86 100
Step by Step Solution
There are 3 Steps involved in it
1 Expert Approved Answer
Step: 1 Unlock

Question Has Been Solved by an Expert!
Get step-by-step solutions from verified subject matter experts
Step: 2 Unlock
Step: 3 Unlock