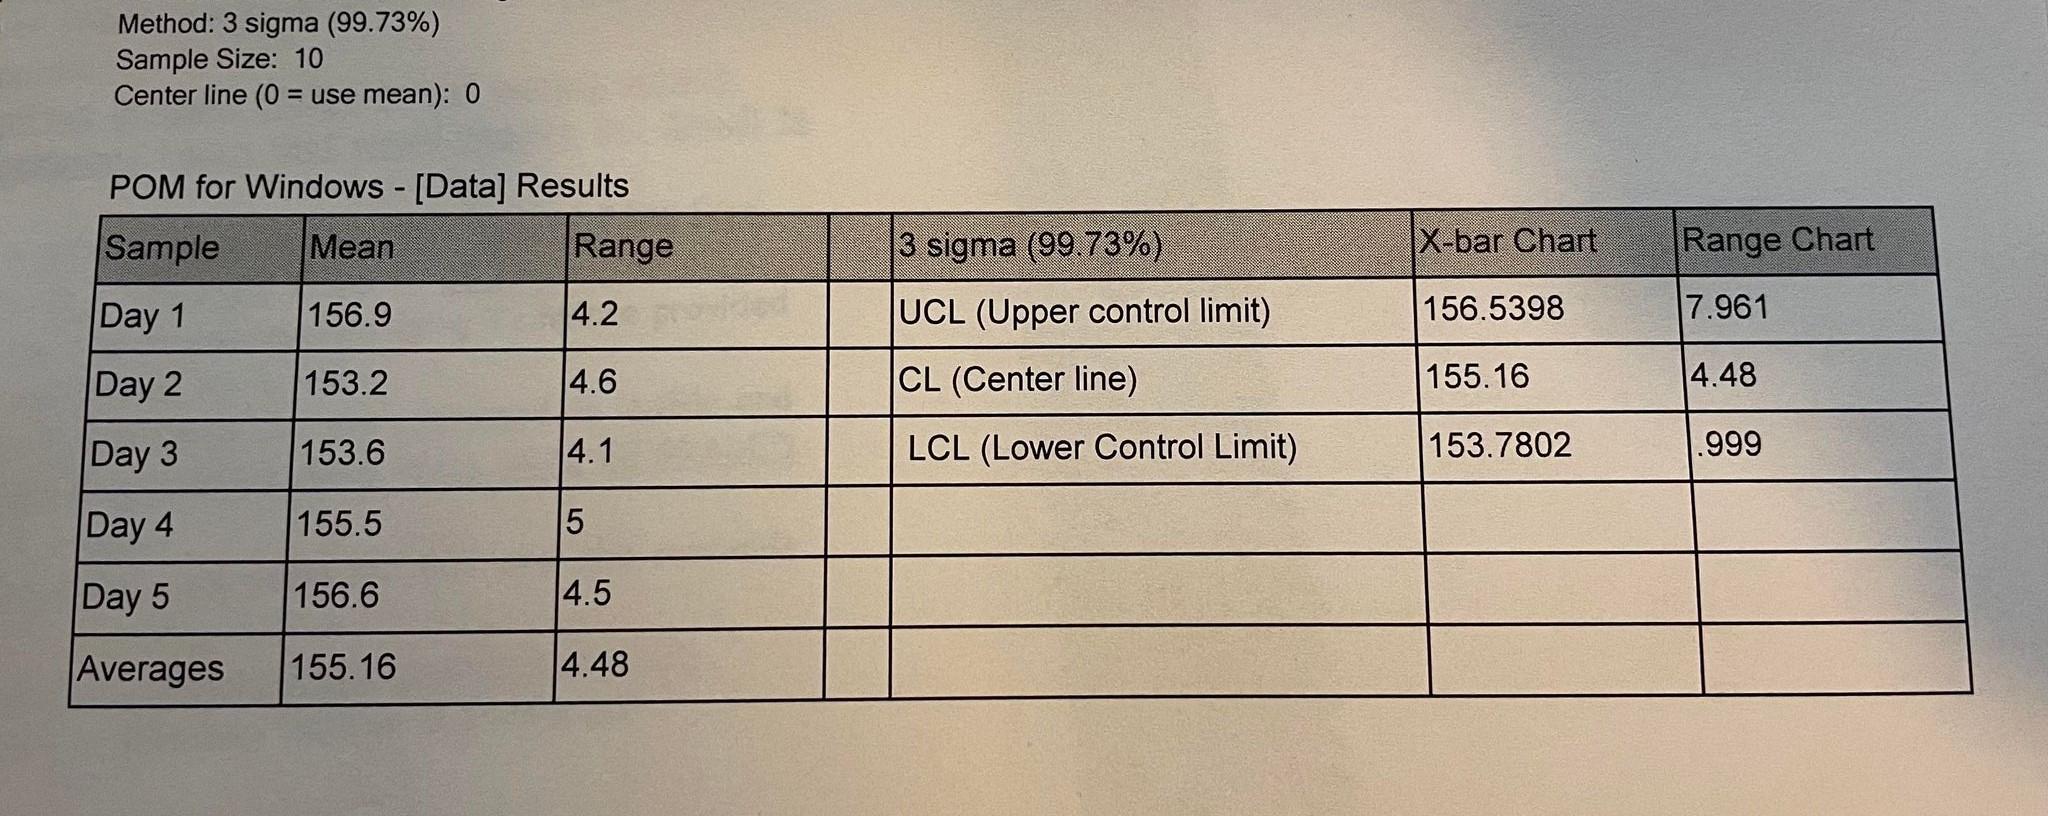
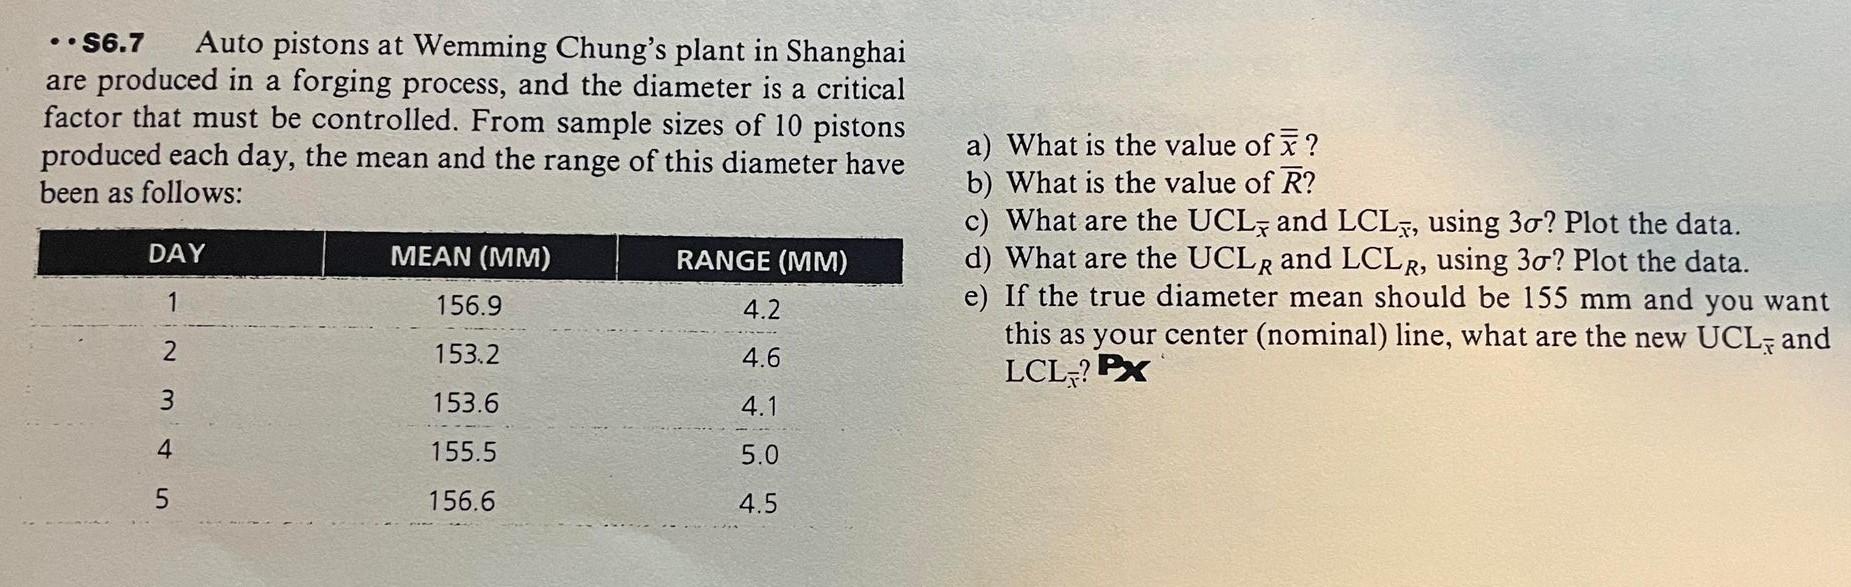
Question: Method: 3 sigma (99.73%) Sample Size: 10 Center line (0 = use mean): 0 -- POM for Windows - [Data] Results Sample Mean Range 3

Method: 3 sigma (99.73%) Sample Size: 10 CenterMethod: 3 sigma (99.73%) Sample Size: 10 Center

Method: 3 sigma (99.73%) Sample Size: 10 Center line (0 = use mean): 0 -- POM for Windows - [Data] Results Sample Mean Range 3 sigma (99.73%) X-bar Chart Range Chart Day 1 156.9 14.2 UCL (Upper control limit) 156.5398 7.961 Day 2 153.2 4.6 CL (Center line) 155.16 4.48 Day 3 153.6 4.1 LCL (Lower Control Limit) 153.7802 .999 Day 4 155.5 5 Day 5 156.6 14.5 Averages 155.16 4.48 . . 56.7 Auto pistons at Wemming Chung's plant in Shanghai are produced in a forging process, and the diameter is a critical factor that must be controlled. From sample sizes of 10 pistons produced each day, the mean and the range of this diameter have been as follows: DAY RANGE (MM) a) What is the value of ? b) What is the value of R? c) What are the UCL; and LCL5, using 30? Plot the data. d) What are the UCLR and LCL R, using 30? Plot the data. e) If the true diameter mean should be 155 mm and you want this as your center (nominal) line, what are the new UCLand LCL ? PX MEAN (MM) 156.9 R 1 4.2 2 153.2 4.6 3 153.6 4.1 m in 4 155.5 5.0 5 156.6 4.5

Step by Step Solution

There are 3 Steps involved in it

1 Expert Approved Answer
Step: 1 Unlock blur-text-image
Question Has Been Solved by an Expert!

Get step-by-step solutions from verified subject matter experts

Step: 2 Unlock
Step: 3 Unlock

Students Have Also Explored These Related General Management Questions!