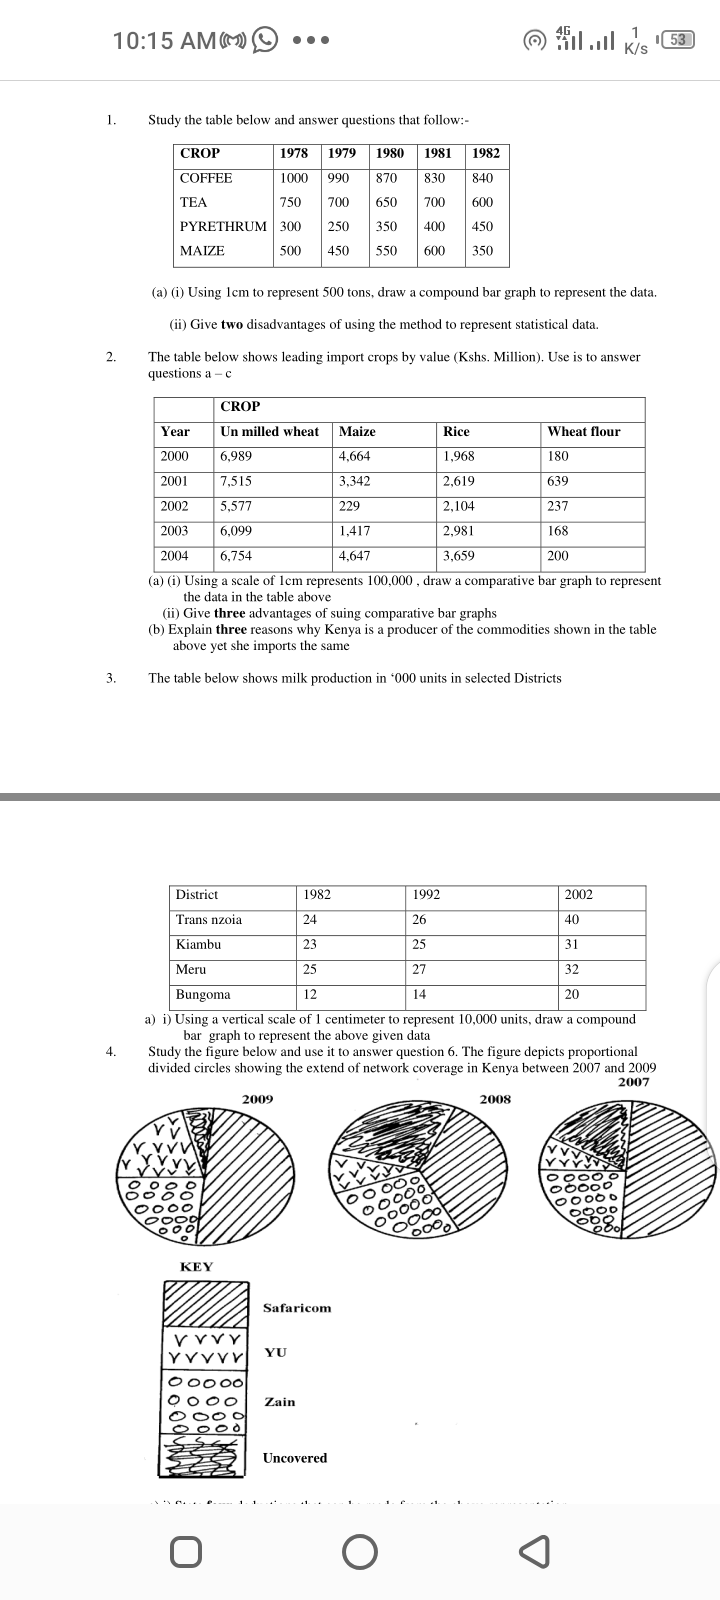
Question: METHODS ASAP 10:15AMMQ 1. Study the table below and answer questions that follow:- CROP 1978 1979 19m 1981 1982 COFFEE 1000 990 870 S30 S40

METHODS ASAP

METHODS ASAP 10:15AMMQ 1. Study the table below
10:15AMMQ 1. Study the table below and answer questions that follow:- CROP 1978 1979 19m 1981 1982 COFFEE 1000 990 870 S30 S40 TEA 750 700 650 7'00 600 PYRETHRUM 300 250 350 400 450 MAIZE 500 450 550 600 350 5F 1 I'll I'll Kits l@ (a) (i) Using lcm to represent 500 tons. draw a compound bar graph to represent the data. (ii) Give two disadvantages of using the method to represent statistical data. 2. The table below shows leading import crops by value (Kshs. Million]. Use is to answer questions a c CROP Un milled wheat Wheat our 6.9 39 180 7.515 639 5.517 237 6.099 108 200 {a} {i} Using a scale of lent represents [00,000 , draw a comparative bar graph to represent the data in the table above (iil Give three advantages of suing comparative bar graphs {b} Explain three reasons why Kenya is a producer of the commodities shown in the table above yet she imports the same 3. The table below shows milk production in '000 units in selected Districts District 1982 1992 2002 Trans nzoia 24 26 40 Kiambu 23 25 3] Meru 25 27 32 Bungoma 12 14 20 a] i) Using a vertical scale of l centimeter to represent 10.000 units. draw a compound bar graph to represent the above given data 4. Sterg.f the gure below and use it to answer question 6. The figure depicts proportional divided circles showing the extend of network coverage in Kenya between 200? and 2009 YU Iain Safe ricnln

Step by Step Solution

There are 3 Steps involved in it

1 Expert Approved Answer
Step: 1 Unlock blur-text-image
Question Has Been Solved by an Expert!

Get step-by-step solutions from verified subject matter experts

Step: 2 Unlock
Step: 3 Unlock

Students Have Also Explored These Related Mathematics Questions!