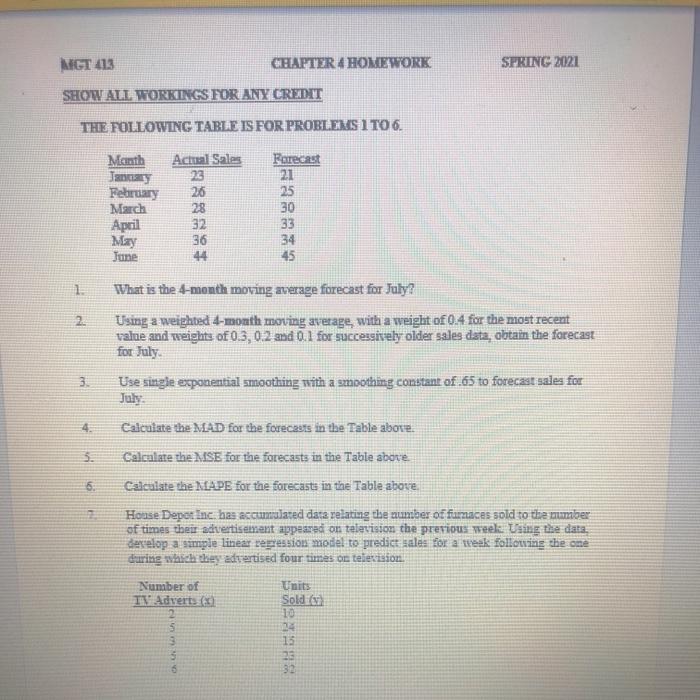
Question: MGT 413 CHAPTER 4 HOMEWORK SPRING 2021 SHOW ALL WORKINGS FOR ANY CREDIT THE FOLLOWING TABLE IS FOR PROBLEMS 1 TO 6. Actual Sales Menth

MGT 413 CHAPTER 4 HOMEWORK SPRING 2021 SHOW ALL
MGT 413 CHAPTER 4 HOMEWORK SPRING 2021 SHOW ALL WORKINGS FOR ANY CREDIT THE FOLLOWING TABLE IS FOR PROBLEMS 1 TO 6. Actual Sales Menth Jangay February March April May June 26 28 32 36 44 Forecast 21 25 30 33 34 45 1 2 What is the 4-month moving average forecast for July? Using a weighted 4-month moving average, with a weight of 0.4 for the most recent value and weights of 0.3, 0.2 and 0.1 for successively older sales data, obtain the forecast for July Use single exponential smoothing with a smoothing constant of 65 to forecast sales for 3. 4. 3. 5. Calculate the MAD for the forecasts in the Table above Calculate the MSE for the forecasts in the Table abore Calculate the MAPE for the forecasts in the Table above House Depot Inc. has accumulated data relating the number of furnaces sold to the number of times their advertisement appeared on television the previous meela. Using the data, develop a simple linear regression model to predict sales for a weak following the one during which they advertised four times on television Number of Adverts Units Sold () 15 6 32

Step by Step Solution

There are 3 Steps involved in it

1 Expert Approved Answer
Step: 1 Unlock blur-text-image
Question Has Been Solved by an Expert!

Get step-by-step solutions from verified subject matter experts

Step: 2 Unlock
Step: 3 Unlock

Students Have Also Explored These Related General Management Questions!