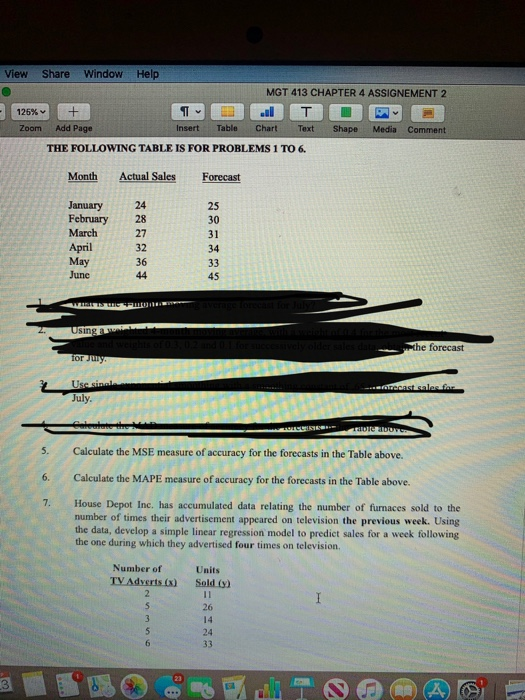
Question: View Share Window Help 125% + Add Page MGT 413 CHAPTER 4 ASSIGNEMENT 2 T Chart Text Shape Media Comment Zoom Insert Table THE FOLLOWING

View Share Window Help 125% + Add Page MGT 413
View Share Window Help 125% + Add Page MGT 413 CHAPTER 4 ASSIGNEMENT 2 T Chart Text Shape Media Comment Zoom Insert Table THE FOLLOWING TABLE IS FOR PROBLEMS 1 TO 6. Month Actual Sales Forecast January February March April May 24 28 27 32 36 44 25 30 31 34 33 45 June WESSUU Using a the forecast Tor Juny - Treasinni eteenstander for July. Galete the DUTC 5. 6. Calculate the MSE measure of accuracy for the forecasts in the Table above. Calculate the MAPE measure of accuracy for the forecasts in the Table above. House Depot Inc. has accumulated data relating the number of furnaces sold to the number of times their advertisement appeared on television the previous week. Using the data, develop a simple linear regression model to predict sales for a week following the one during which they advertised four times on television, 7. Units Sold (9) Number of TV Adverts (x) 2 5 3 5 6 I 26 14 24 33 3

Step by Step Solution

There are 3 Steps involved in it

1 Expert Approved Answer
Step: 1 Unlock blur-text-image
Question Has Been Solved by an Expert!

Get step-by-step solutions from verified subject matter experts

Step: 2 Unlock
Step: 3 Unlock

Students Have Also Explored These Related General Management Questions!