

Question: Microeconomics 1. Fill in the cost function chart below: Q FC VC TC AFC AVC ATC 1 120 10 2 20 3 27 4 32
Microeconomics 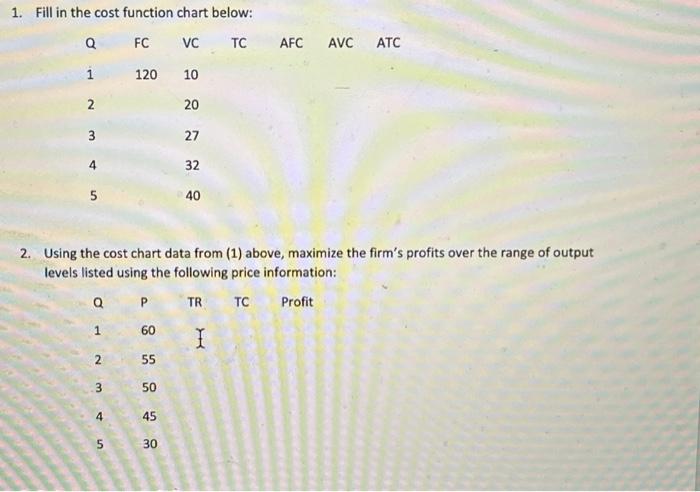
1. Fill in the cost function chart below: Q FC VC TC AFC AVC ATC 1 120 10 2 20 3 27 4 32 5 5 40 2. Using the cost chart data from (1) above, maximize the firm's profits over the range of output levels listed using the following price information: Q TC Profit P TR 1 60 I 2 55 3 50 4 45 5 30
Step by Step Solution
There are 3 Steps involved in it
1 Expert Approved Answer
Step: 1 Unlock

Question Has Been Solved by an Expert!
Get step-by-step solutions from verified subject matter experts
Step: 2 Unlock
Step: 3 Unlock