

Question: Microeconomics Homework Chapter 3 Need help with question Below Homework: ASSESS Chapter 3 Homework Question 25, Concept Question 5.5 HW Score: 38%, 9.5 of 25
Microeconomics Homework
Chapter 3
Need help with question Below
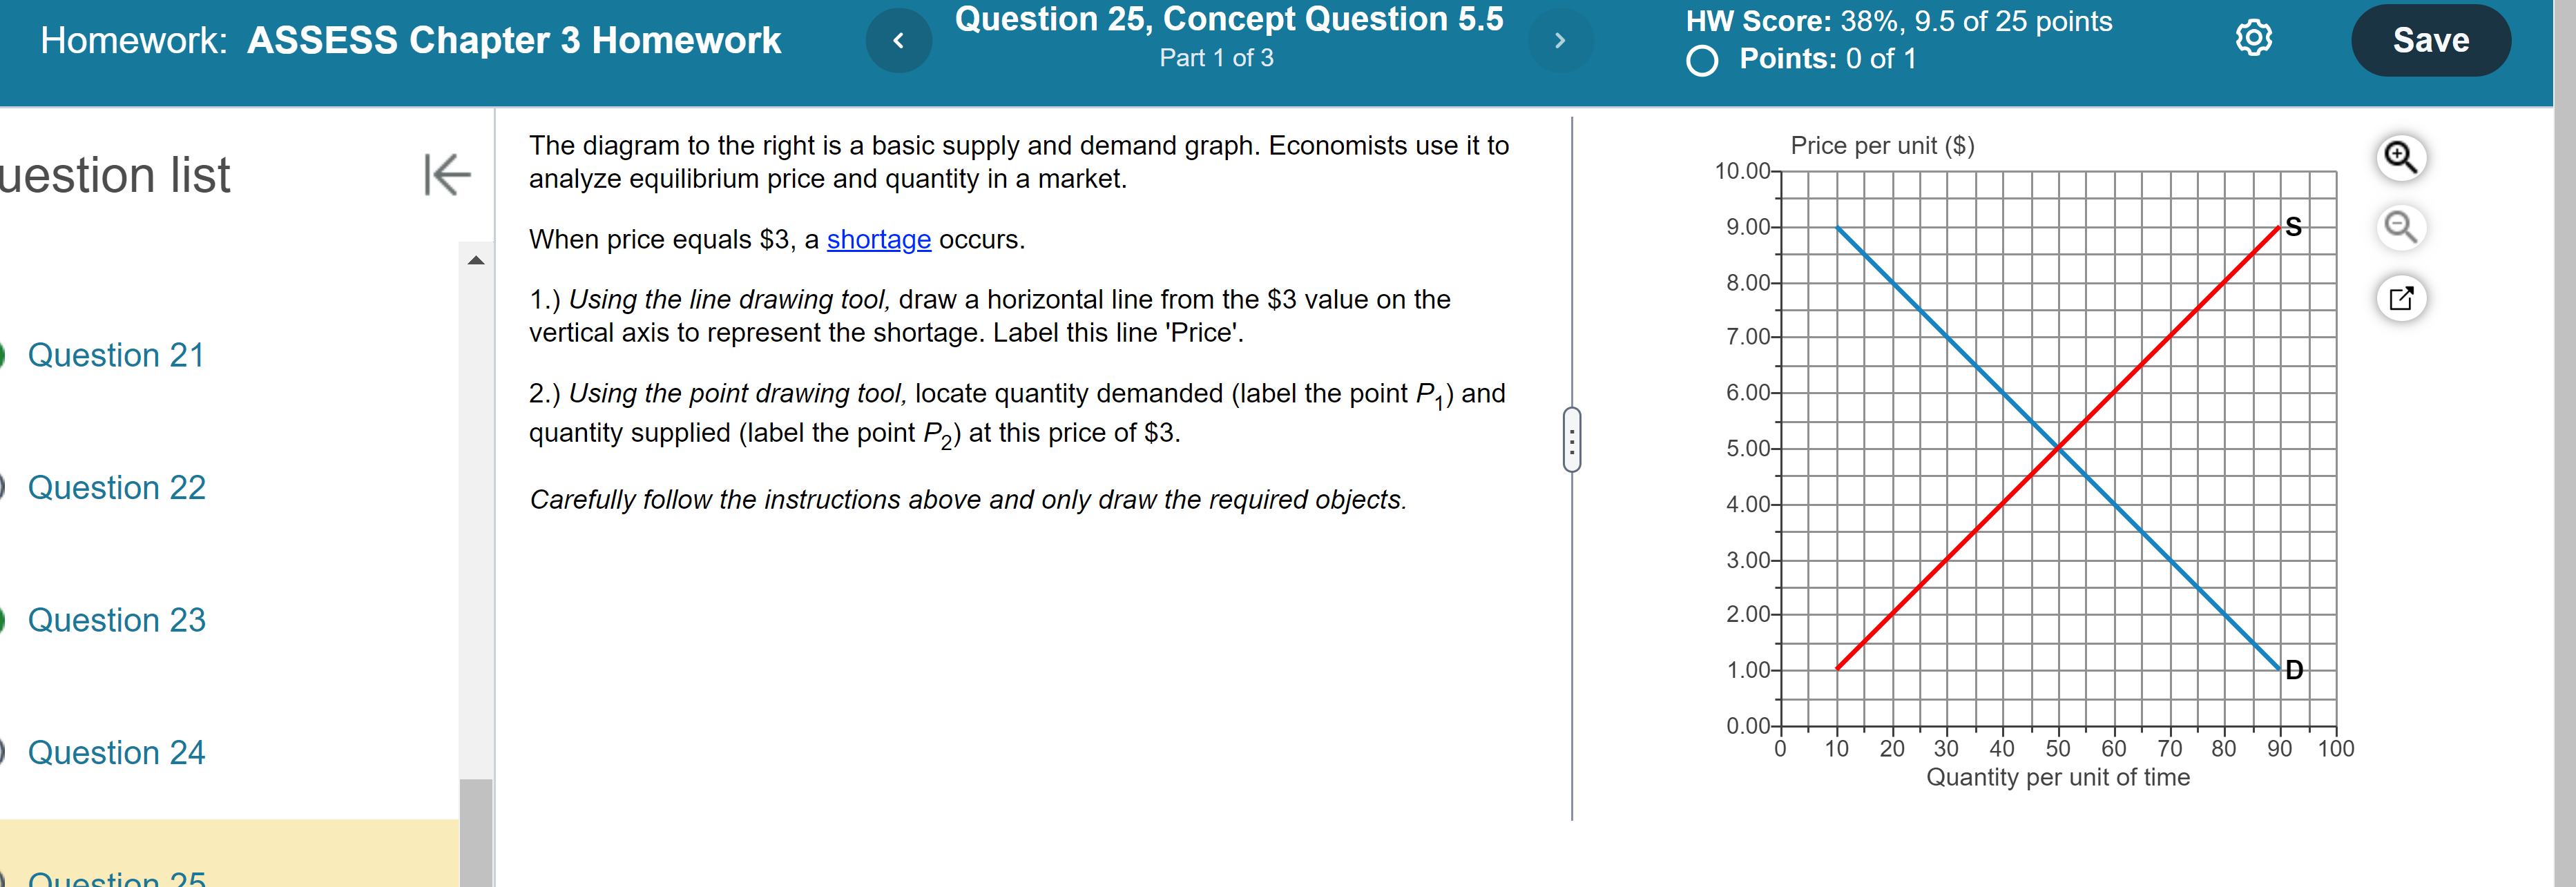
Homework: ASSESS Chapter 3 Homework Question 25, Concept Question 5.5 HW Score: 38%, 9.5 of 25 points Part 1 of 3 O Points: 0 of 1 Save K The diagram to the right is a basic supply and demand graph. Economists use it to uestion list Price per unit ($) analyze equilibrium price and quantity in a market. 10.00- When price equals $3, a shortage occurs. 9.00- 8.00- 1.) Using the line drawing tool, draw a horizontal line from the $3 value on the Question 21 vertical axis to represent the shortage. Label this line 'Price' 7.00- 2.) Using the point drawing tool, locate quantity demanded (label the point P, ) and 6.00- quantity supplied (label the point P2) at this price of $3. 5.00- Question 22 Carefully follow the instructions above and only draw the required objects. 4.00- 3.00- Question 23 2.00- 1.00- D 0.00 Question 24 0 10 20 30 40 50 60 70 80 90 100 Quantity per unit of time
Step by Step Solution
There are 3 Steps involved in it

Get step-by-step solutions from verified subject matter experts